Quick QRadar Dashboards with Metabase BI
Posted on 16 October 2023
TweetIntroduction
Have you ever wanted to quickly create an interactive QRadar Dashboard on a modern, open-source, self-service Business Intelligence (BI) tool?
In this step-by-step tutorial, we will learn how to leverage Metabase and its new CSV upload feature to import data exports from QRadar and create interactive Dashboards to gather valuable insights.
Note: This tutorial assumes you have admin access to a live QRadar deployment. For the purpose of this tutorial, I am using QRadar Community Edition. Please follow my step-by-step guide - How to install IBM QRadar CE V7.3.3 on VirtualBox to get a basic QRadar deployment up and running in your lab environment.
Pre-requisites
- QRadar with admin access
I am using QRadar CE V7.3.3 as described above.
- MySQL
I am using MySQL Ver 8.0.34 on a CentOS 7 Linux VM. For more information about installing MySQL 8.0 on your OS, please refer to MySQL Installation Guide.
- Metabase Open Source Edition
I am using Metabase v0.47.2 on a CentOS 7 Linux VM. For more information about installing Metabase Open Source Edition on your OS, please refer to Metabase Open Source Edition.
Metabase
According to Metabase documentation:
Metabase is an open-source business intelligence tool. Metabase lets you ask questions about your data, and displays answers in formats that make sense, whether that’s a bar chart or a detailed table.
You can save your questions, and group questions into handsome dashboards. Metabase also makes it easy to share questions and dashboards with the rest of your team.
CSV Uploads on Metabase
According to Metabase documentation:
You can upload data in CSV format to Metabase and start asking questions about it. This feature is best suited for ad hoc analysis of spreadsheet data. If you have a lot of data, or will need to update or add to that data regularly, we recommend setting up a way to load that data into a database directly, then connecting Metabase to that database.
The above snippet from the documentation aptly summarizes the benefits and drawbacks of the CSV feature.
In the past, the only available option was to connect Metabase to a supported database. From our perspective, this means that we need to setup ETL (Extract-Transform-Load) pipelines to fetch data from QRadar (using REST APIs), perform transformations, and persist the transformed data into database tables.
Obviously, it is no simple feat to write, test, and maintain production-ready ETL pipelines. While it is still necessary for most reporting use cases, it is overkill for creating ad hoc Dashboards with quickly exported data. Hence, this new feature from Metabase is a blessing. It is similar to the functionality offered by other popular BI tools such as Power BI.
Note: Please refer to my blog post titled QRadar REST APIs with Logstash to learn how to develop ETL pipelines on Logstash to programatically fetch raw data from QRadar REST APIs, apply processing, and output into various formats and destinations.
Creating Dashboards
In this section, we will delve into the steps required to create our desired Dashboard on Metabase.
First, we will start by exporting the required CSV data from the QRadar Console. The next step involves configuring Metabase to accept CSV uploads. However, prior to enabling CSV uploads on Metabase, we need to create a new MySQL database and connect it to Metabase. Once the MySQL database is connected to Metabase, we can enable CSV uploads and choose the newly created database as the database to be used for uploads. Next, we will upload the exported QRadar CSV to Metabase as a Model. This step also involves configuring the appropriate column types. Finally, we will leverage the Model to ask Questions and create a new Dashboard with multiple metrics and visualizations.
Exporting QRadar Data
The first step involves exporting the necessary data from the QRadar Console. For the purpose of this tutorial, we will export Offenses from QRadar.
Log in to the QRadar Console. Click on Offenses to navigate to the Offenses tab.
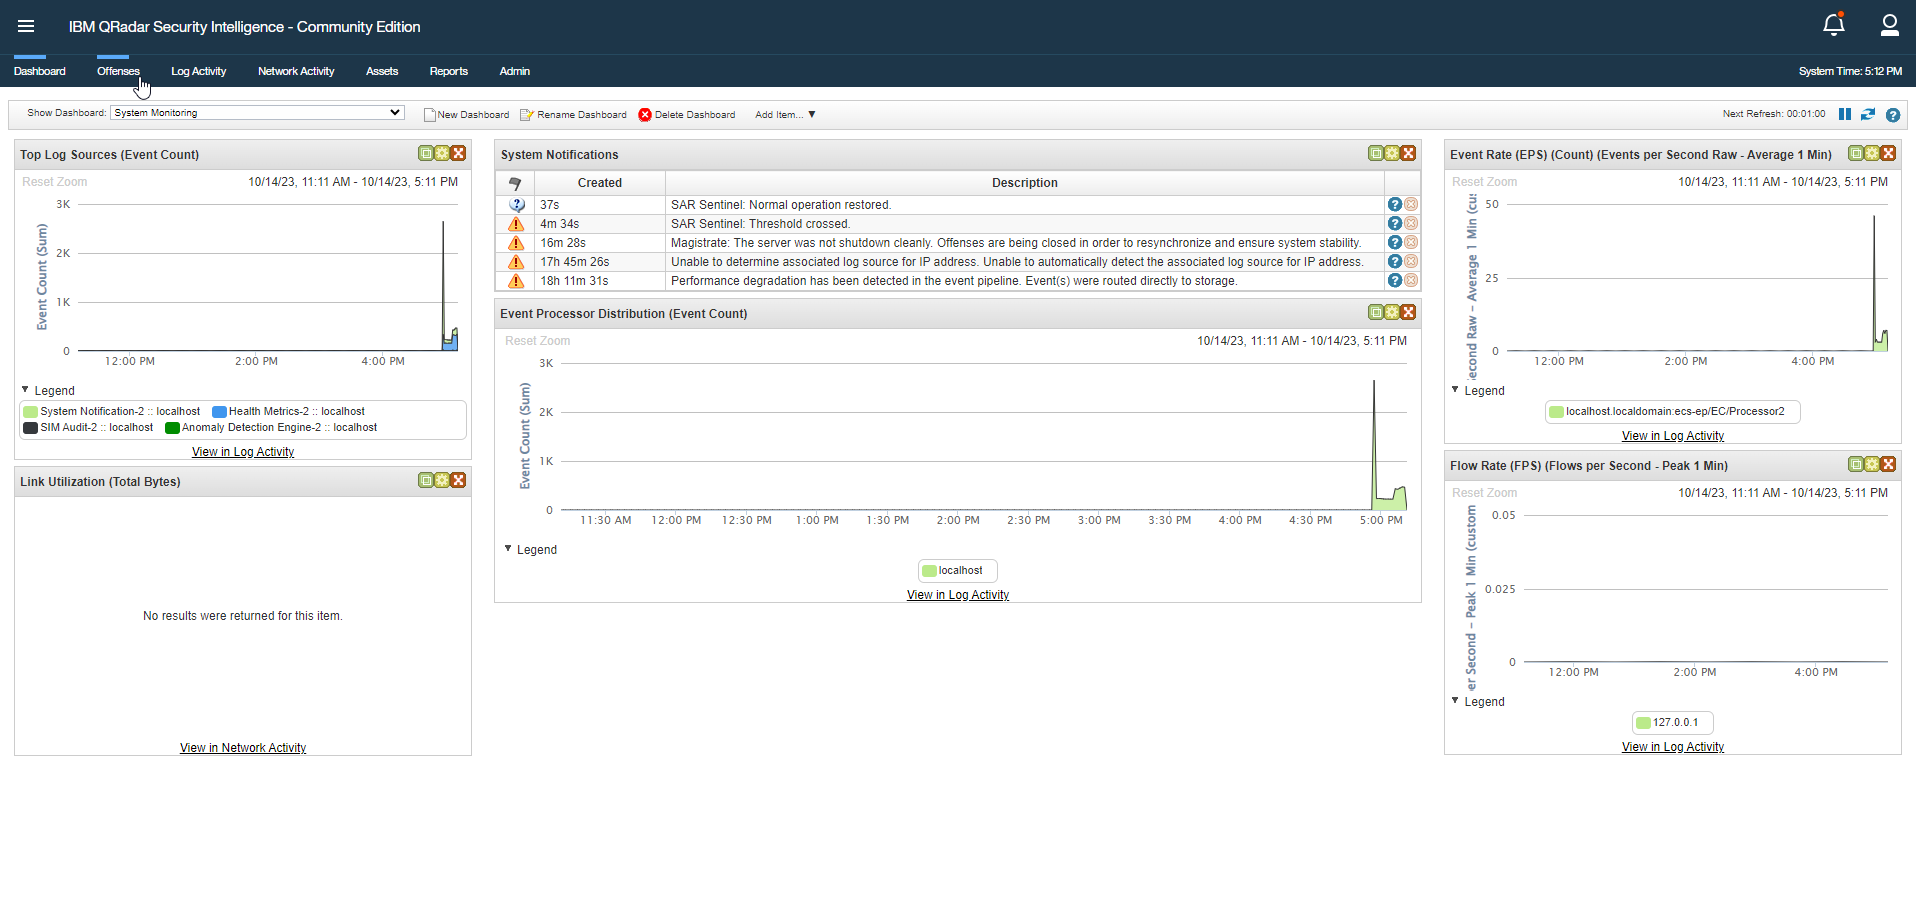
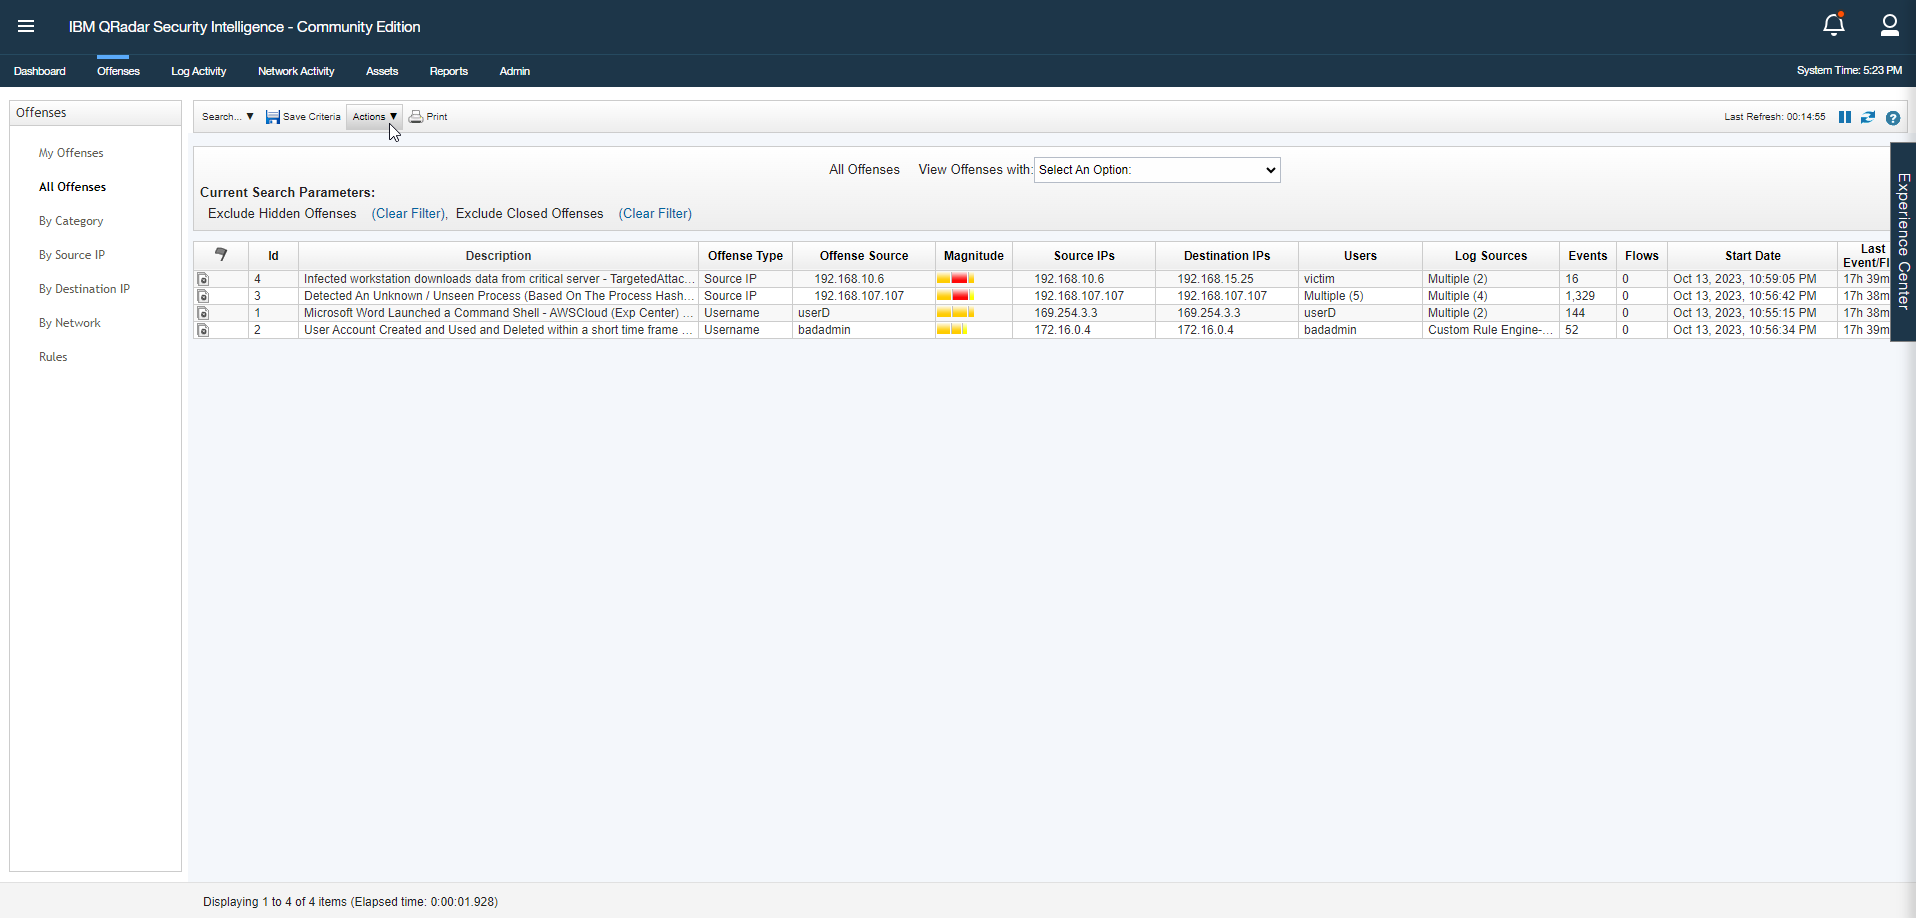
In the Offenses tab, the latest active Offenses are displayed. Click on Actions.
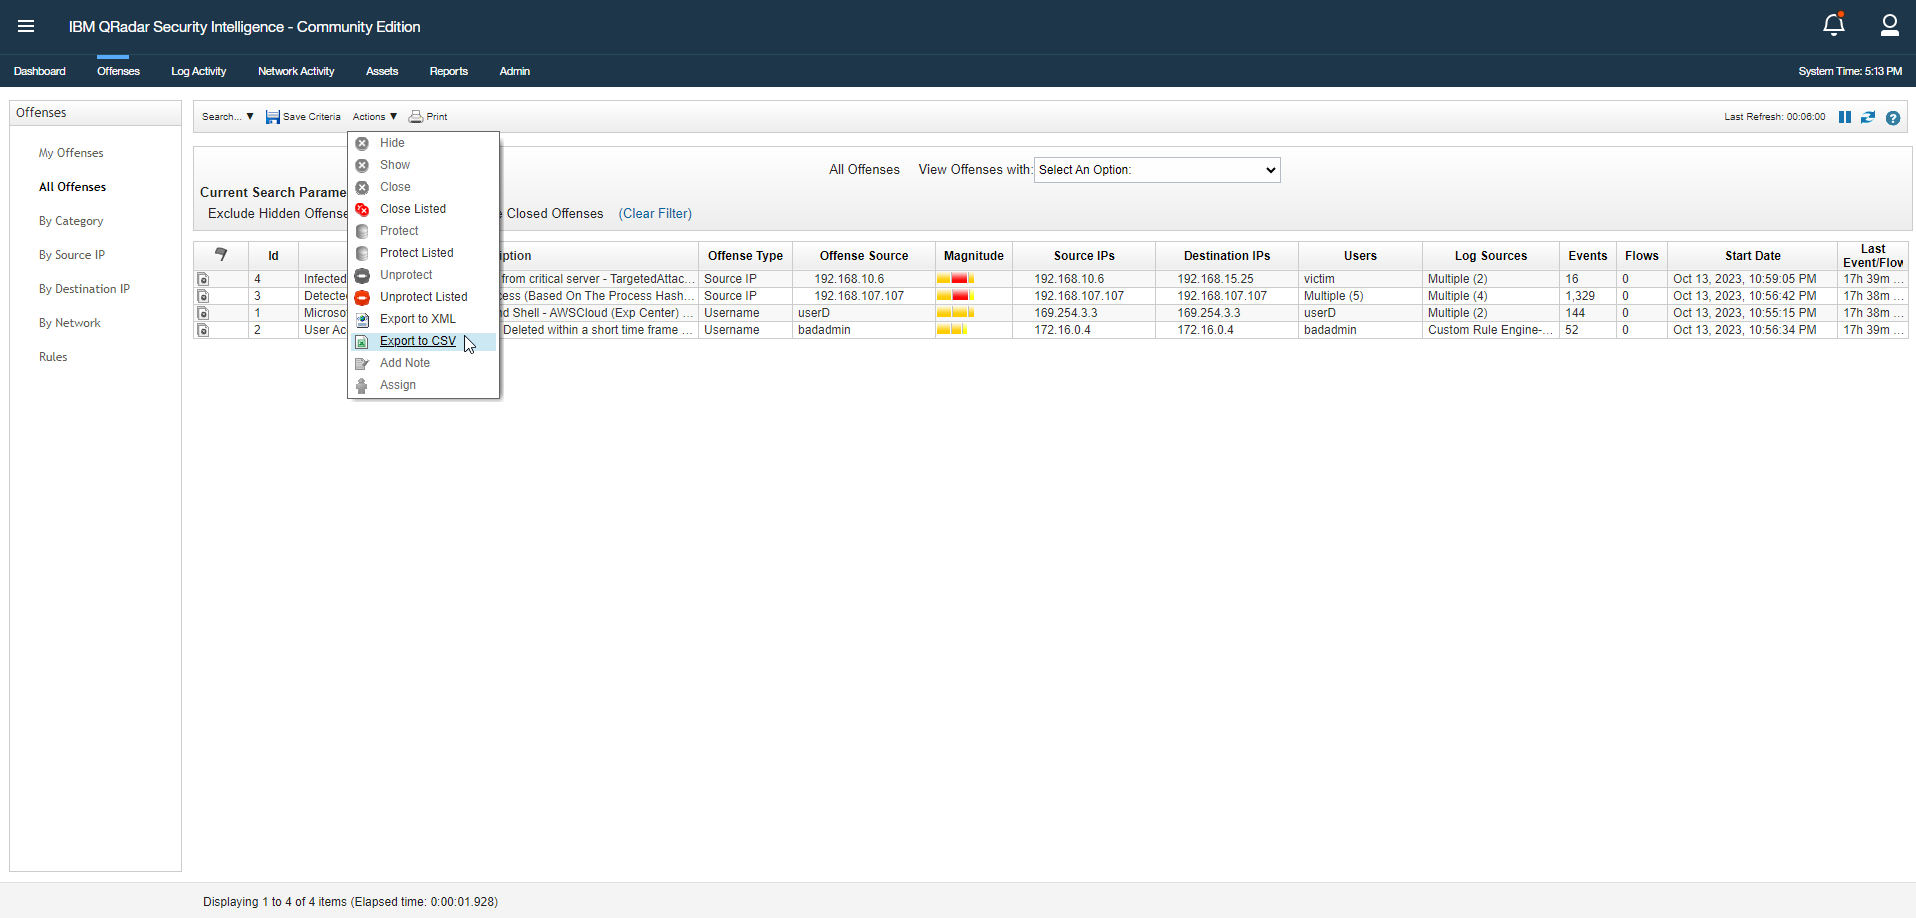
Under the Actions menu, select Export to CSV.
The export will commence. The duration of the export will be determined by the number of Offenses to be exported. Ensure your filters are appropriately set prior to initiating the export.
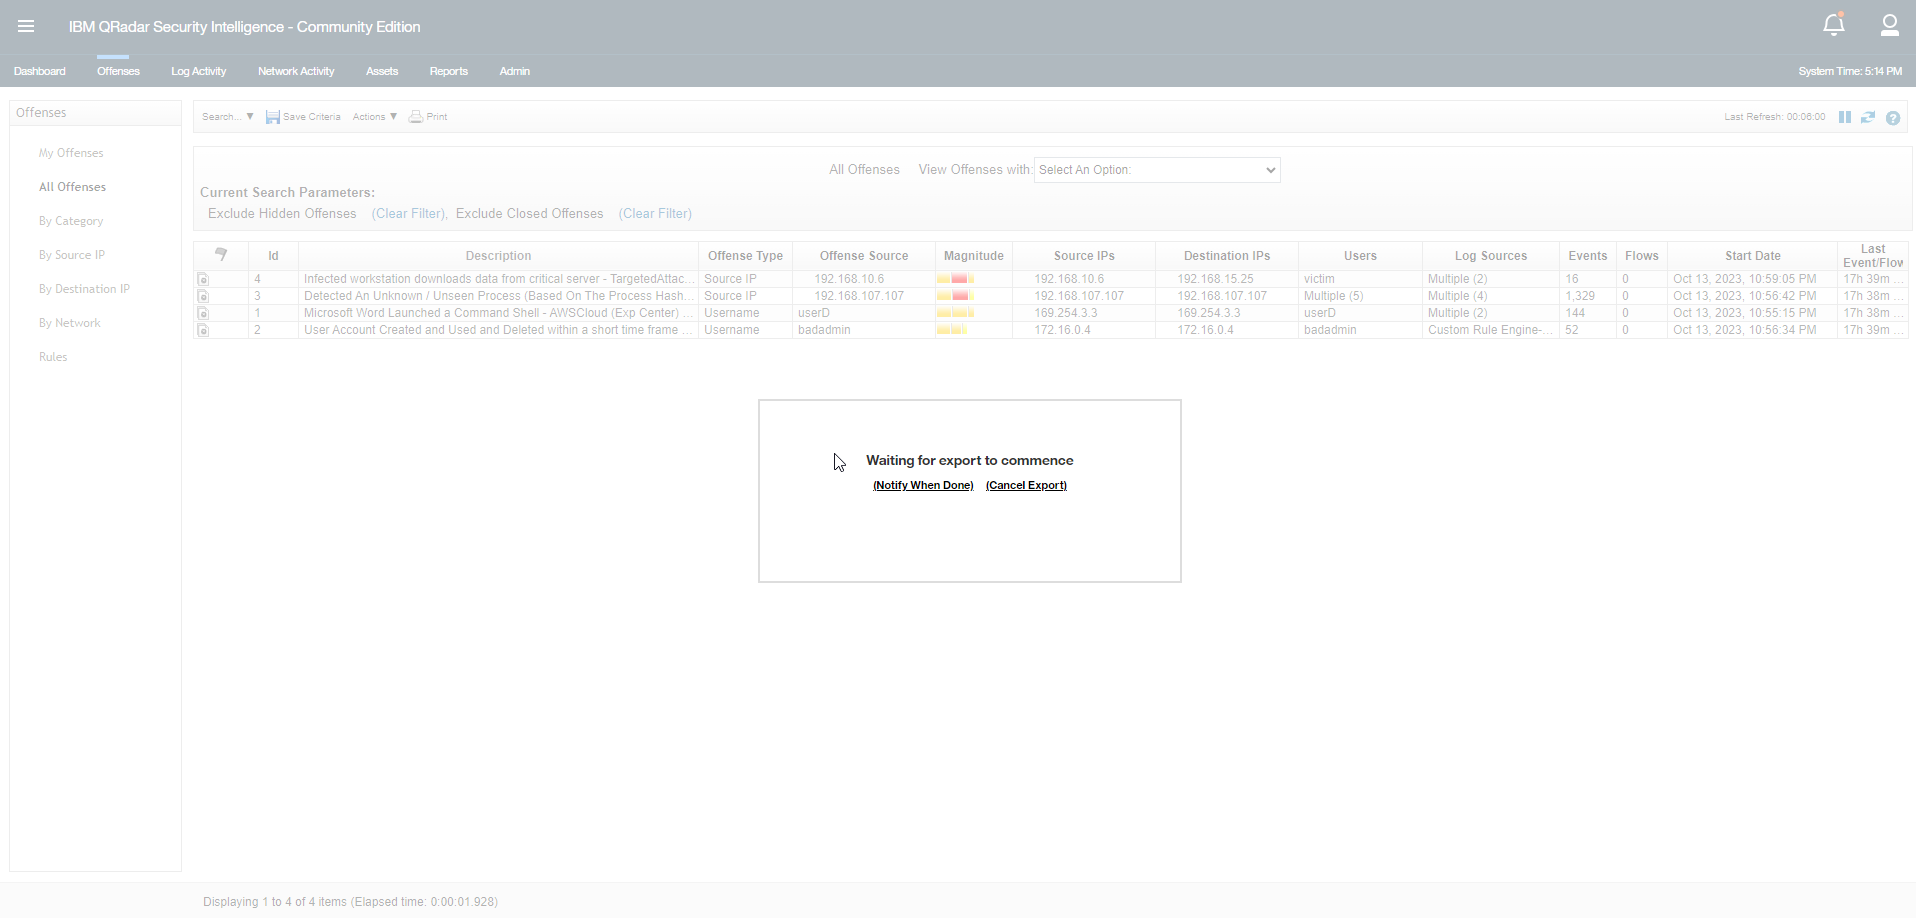
Download the compressed ZIP file to a local directory.

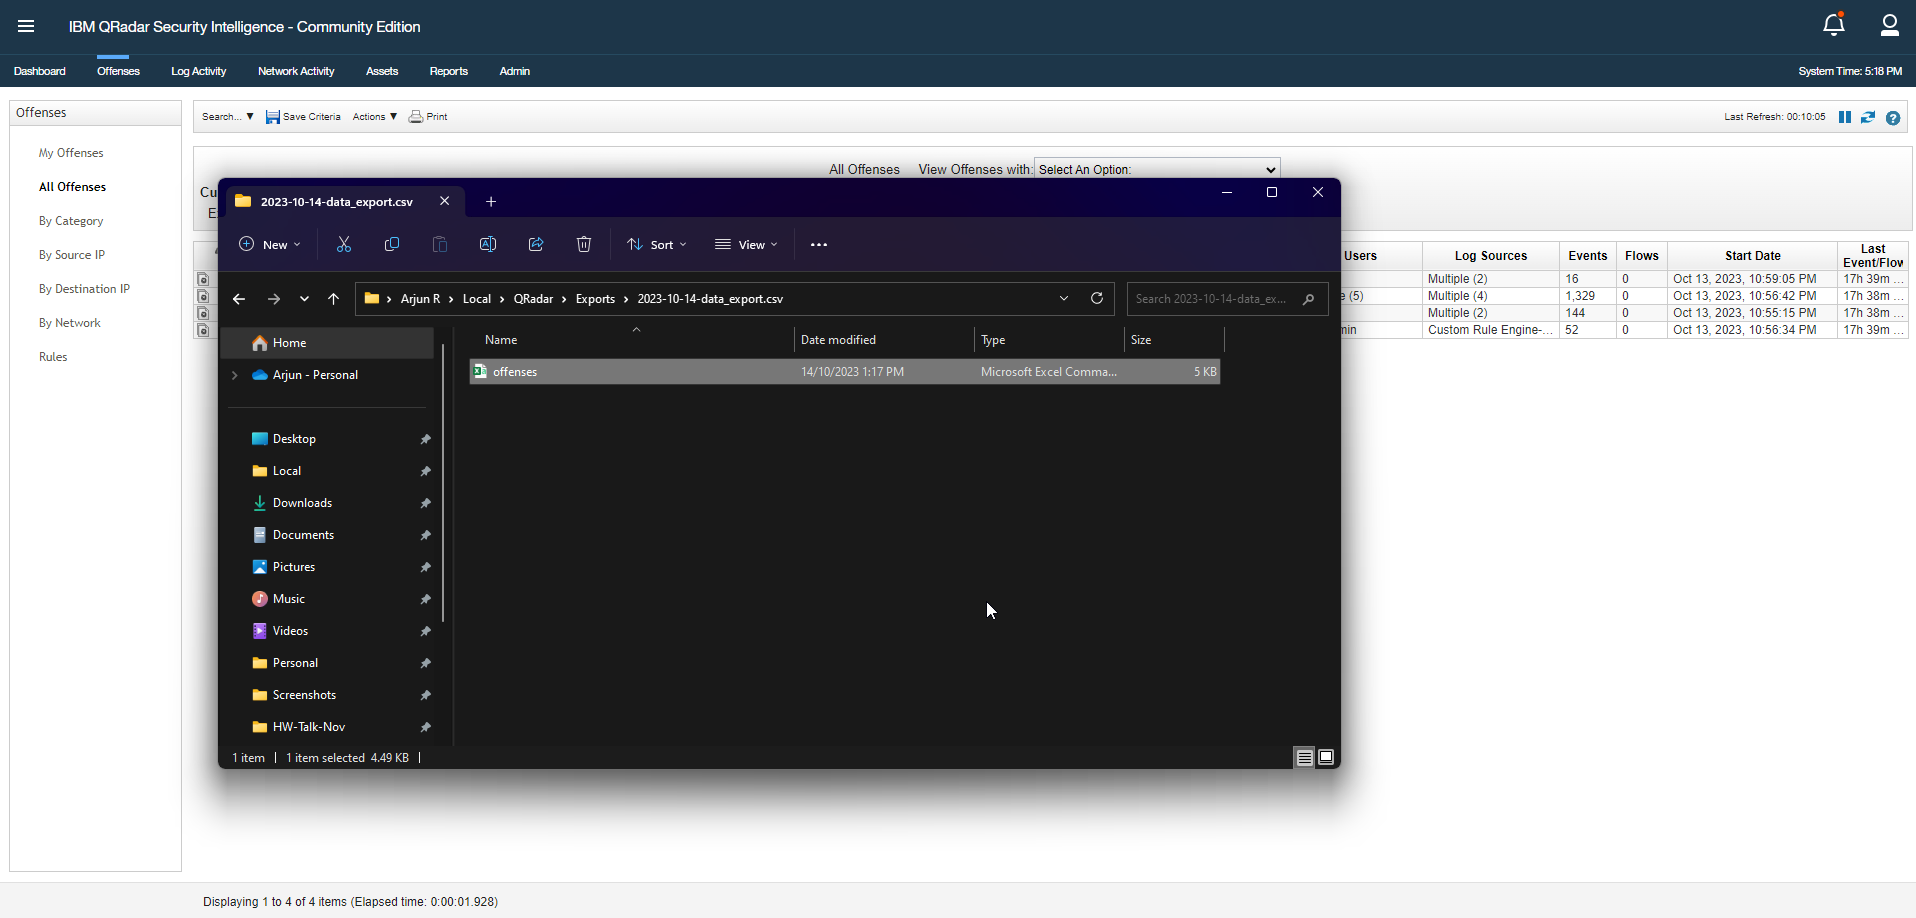
Unzip the compressed file to extract the CSV file.
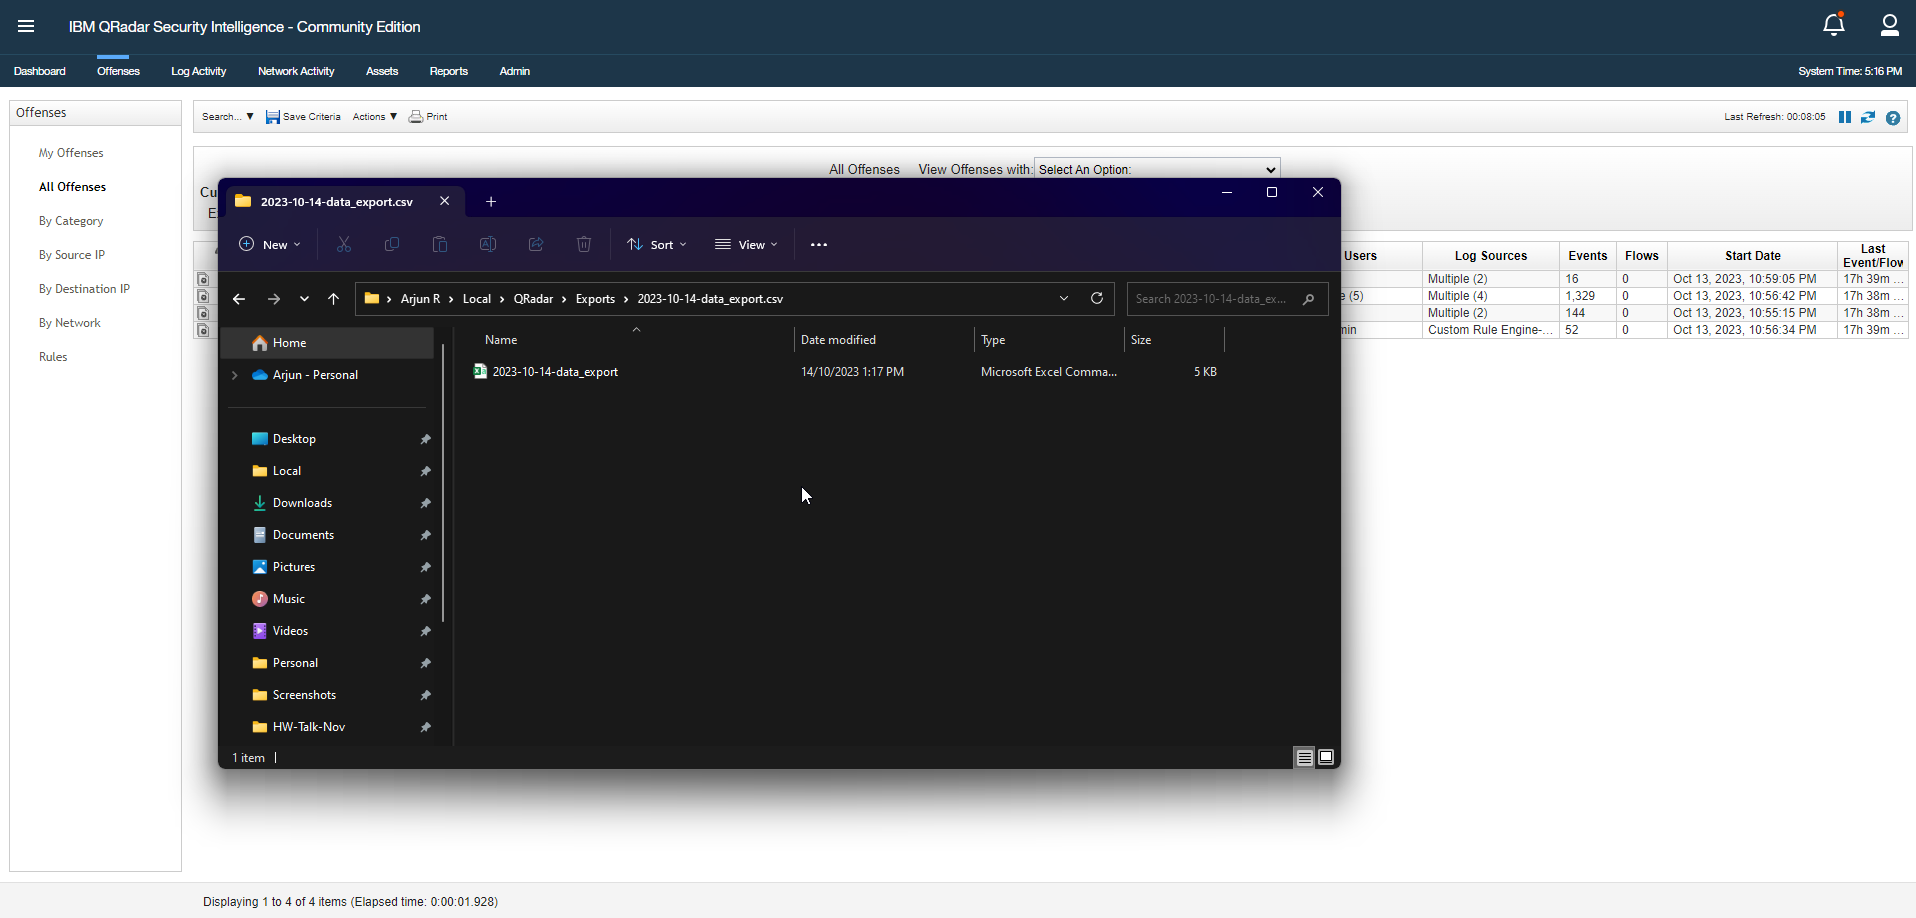
For the sake of clarity, rename the CSV file to offenses.
Open the CSV file in Excel (or a text editor of your choice) to view its contents. Validate the columns and rows. The number of Offenses on the CSV file must match the number displayed on the Offenses tab on the QRadar Console.
Note: It is to be expected that the export will contain ALL the relevant columns pertaining to each Offense.
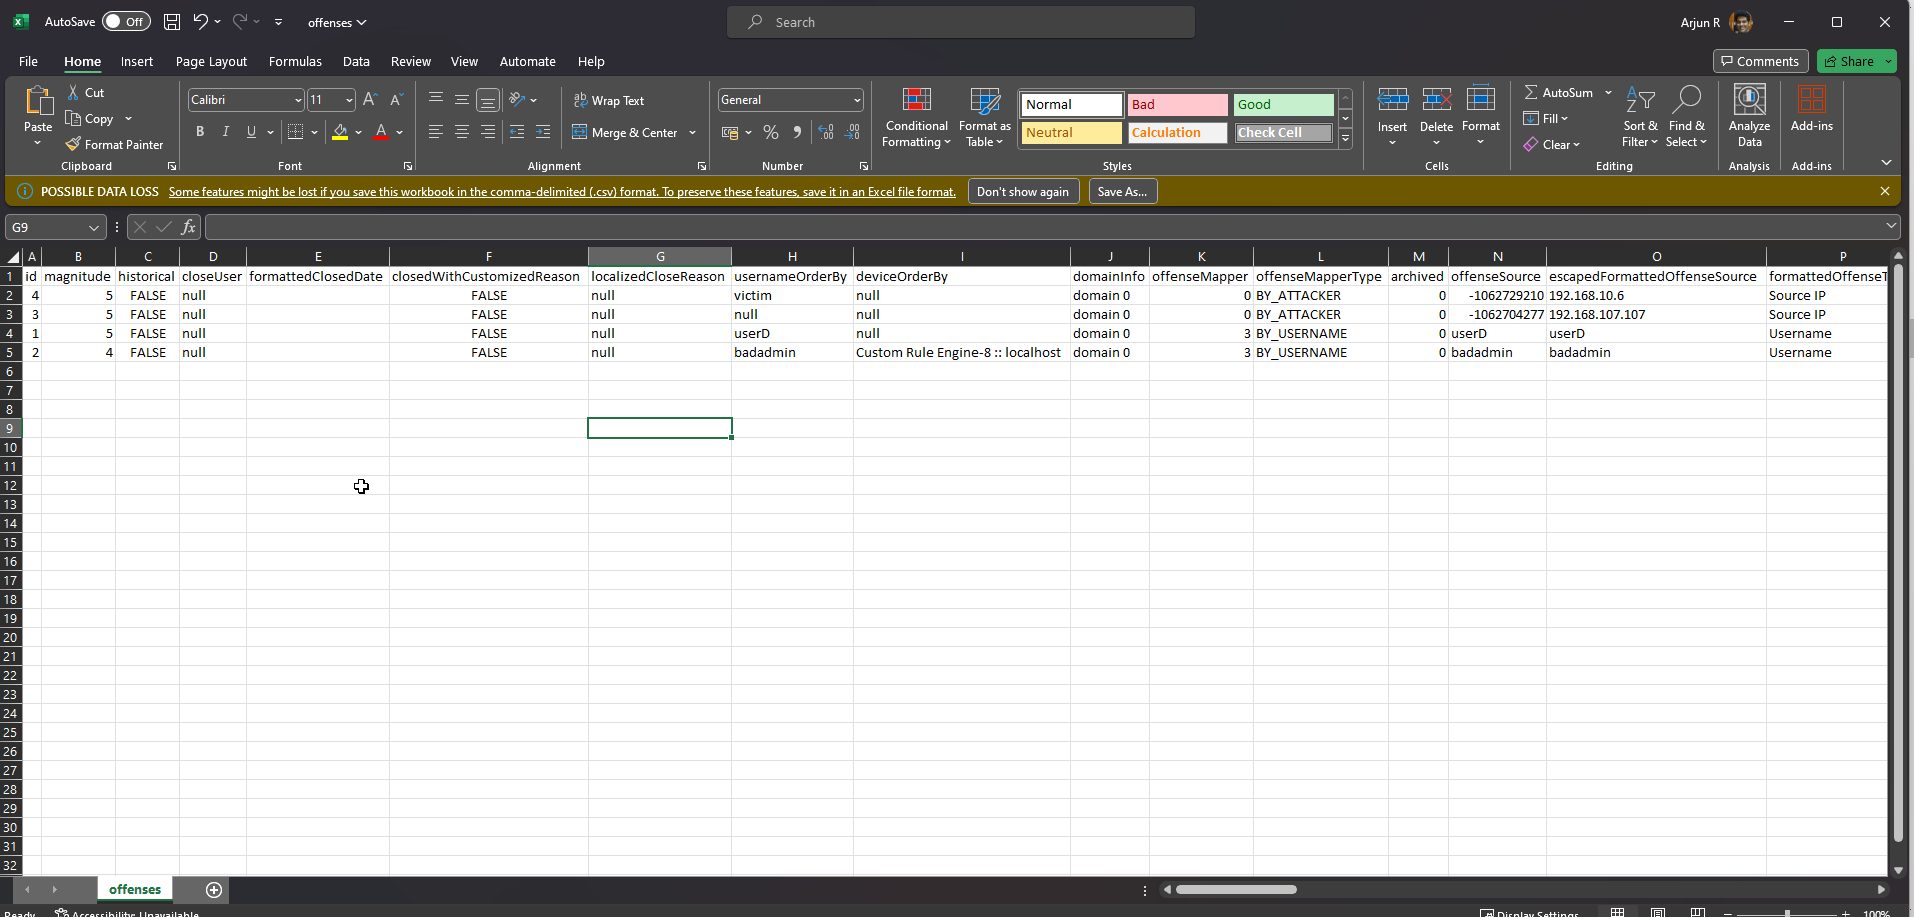
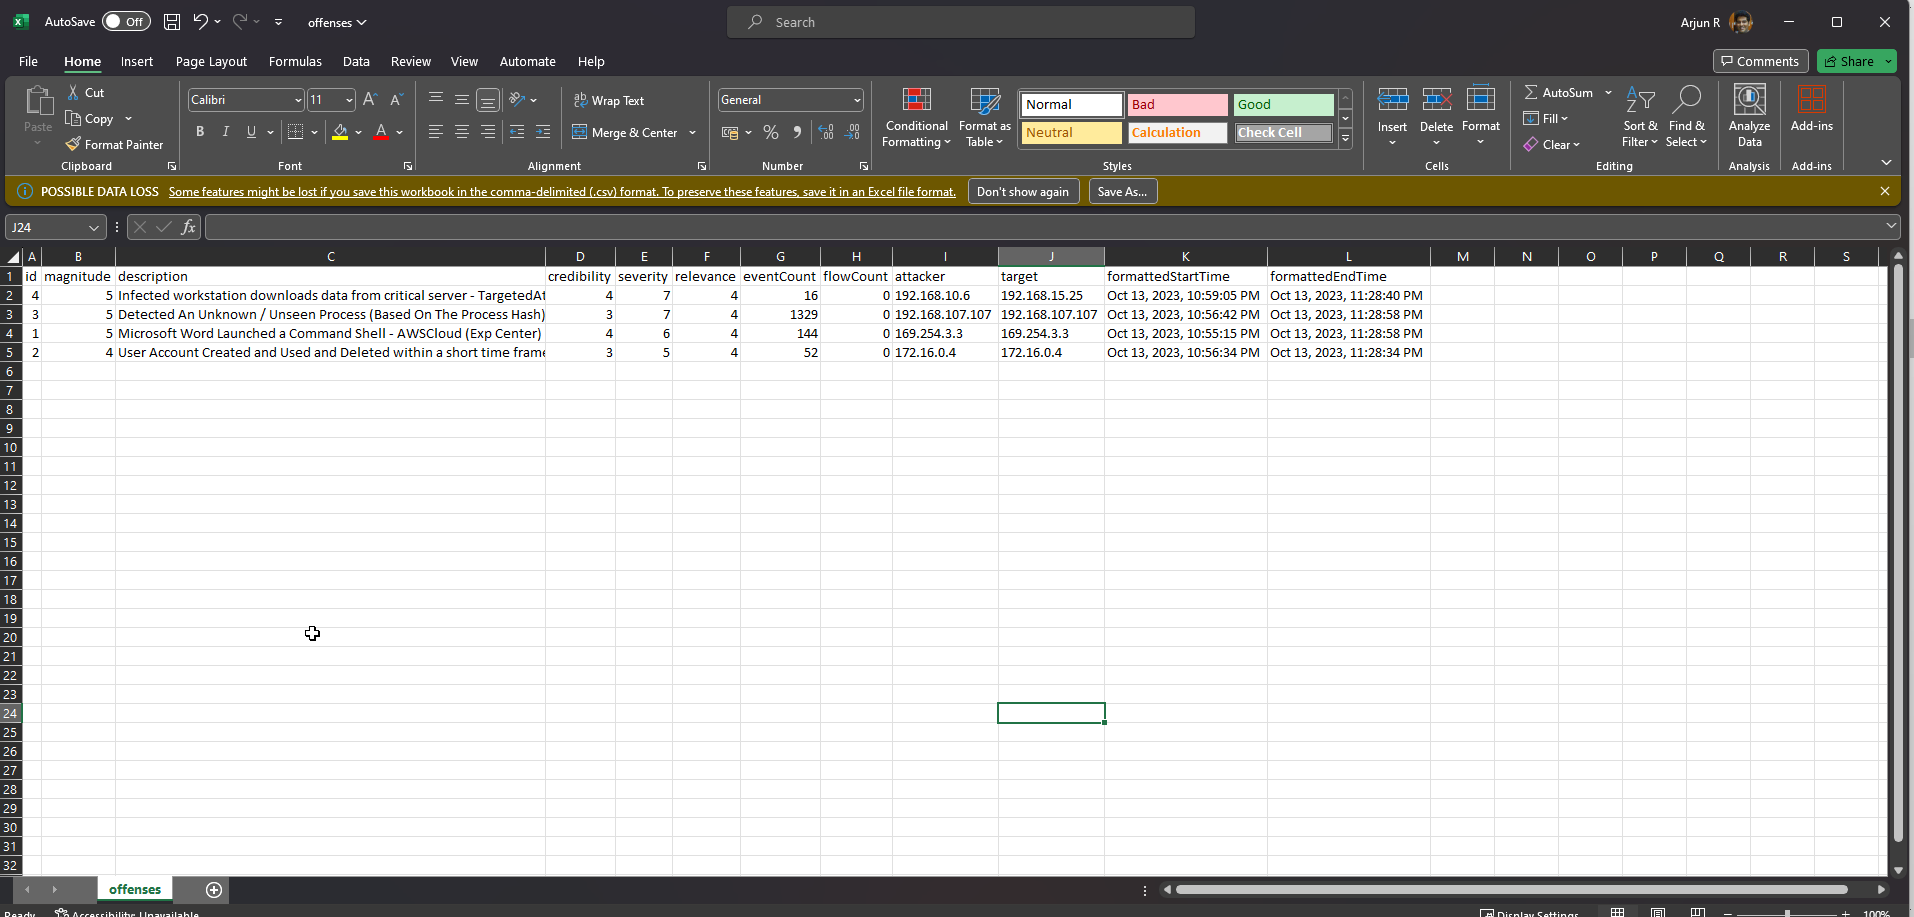
For the purpose of this tutorial, we will purge a couple of columns and retain only a few relevant ones.
Note: The retained columns are:
id,magnitude,description,credibility,severity,relevance,eventCount,flowCount,attacker,target,formattedStartTime,formattedEndTime.
Configuring Metabase
With the Offenses exported from QRadar, the next step involves configuring Metabase to enable the CSV upload feature.
Configuring MySQL Database on Metabase
According to Metabase documentation:
There are a few things admins need to do to support CSV uploads:
- Connect to a database using a database user account with write access. This way Metabase will be able to store the uploaded data somewhere.
- Select the database and schema you want to store the uploaded data in.
- Add people to a group with unrestricted data access to the upload schema database.
- (Optional) specify a prefix for Metabase to prepend to the uploaded tables.
Essentially, this means that we need a database that will be used to store the uploaded CSV data. As mentioned in the pre-requisites, we have chosen MySQL. However, you can also choose PostgreSQL, which is the only other database that supports CSV uploads on Metabase.
To connect the MySQL database with Metabase, start by connecting to MySQL. I am using the MySQL client (mysql).
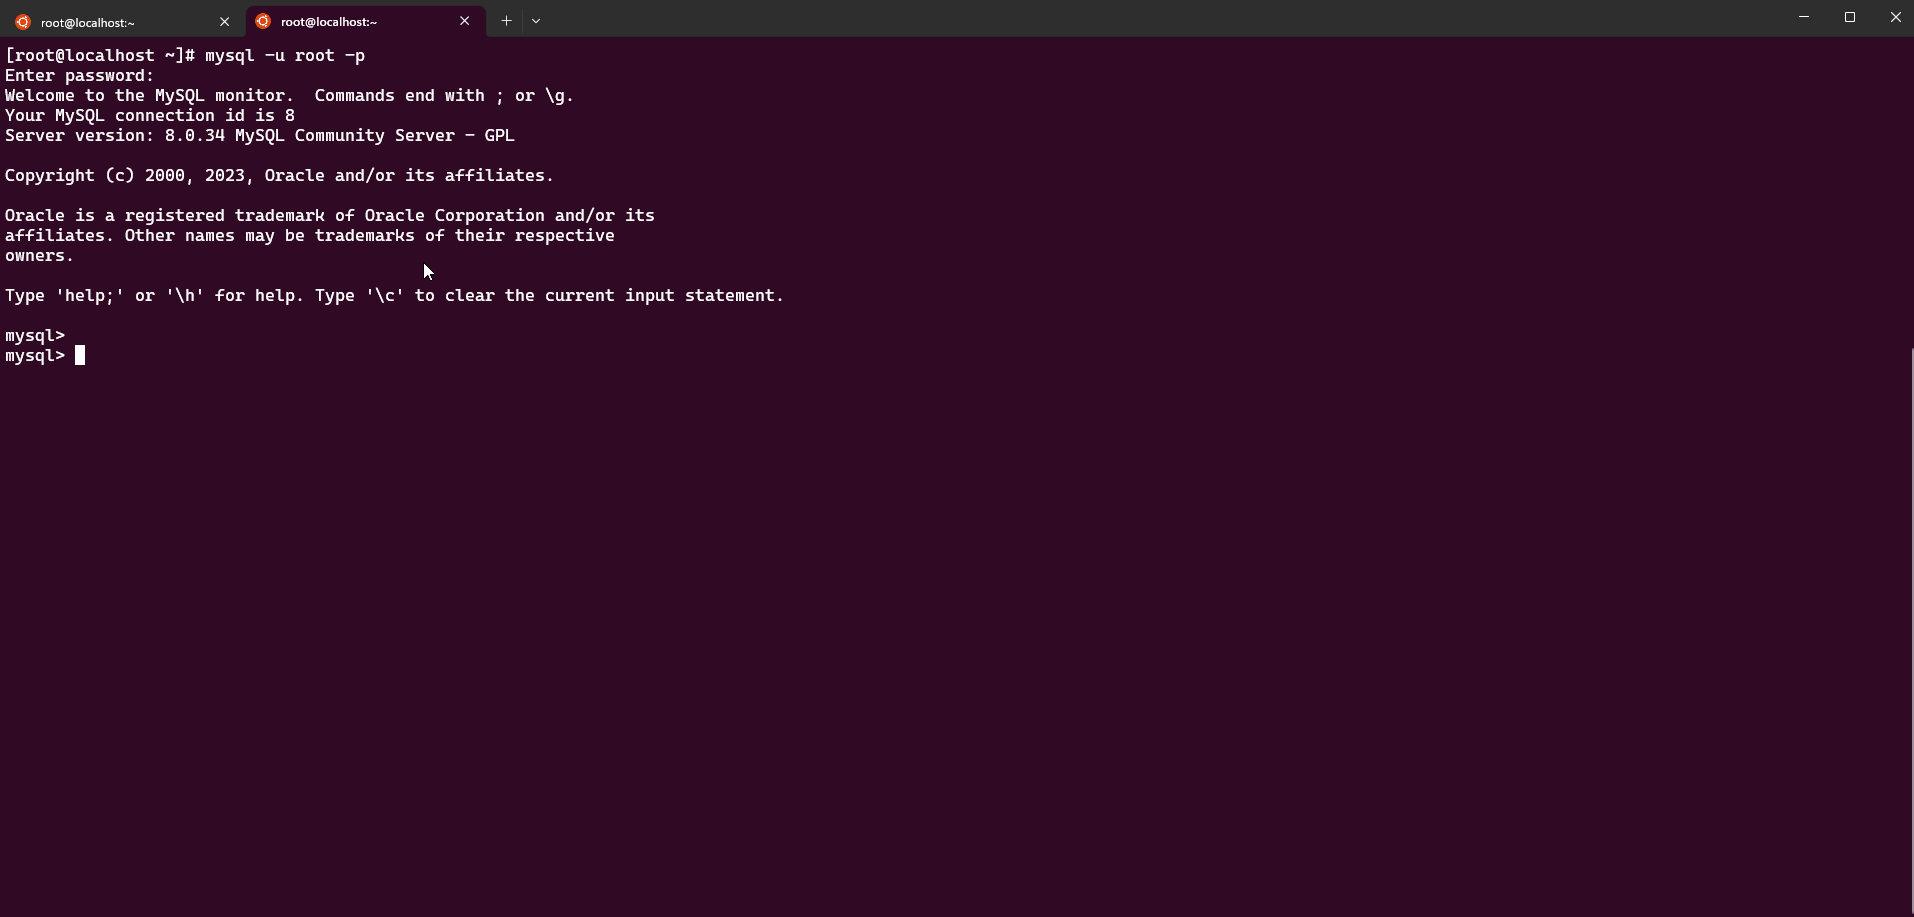
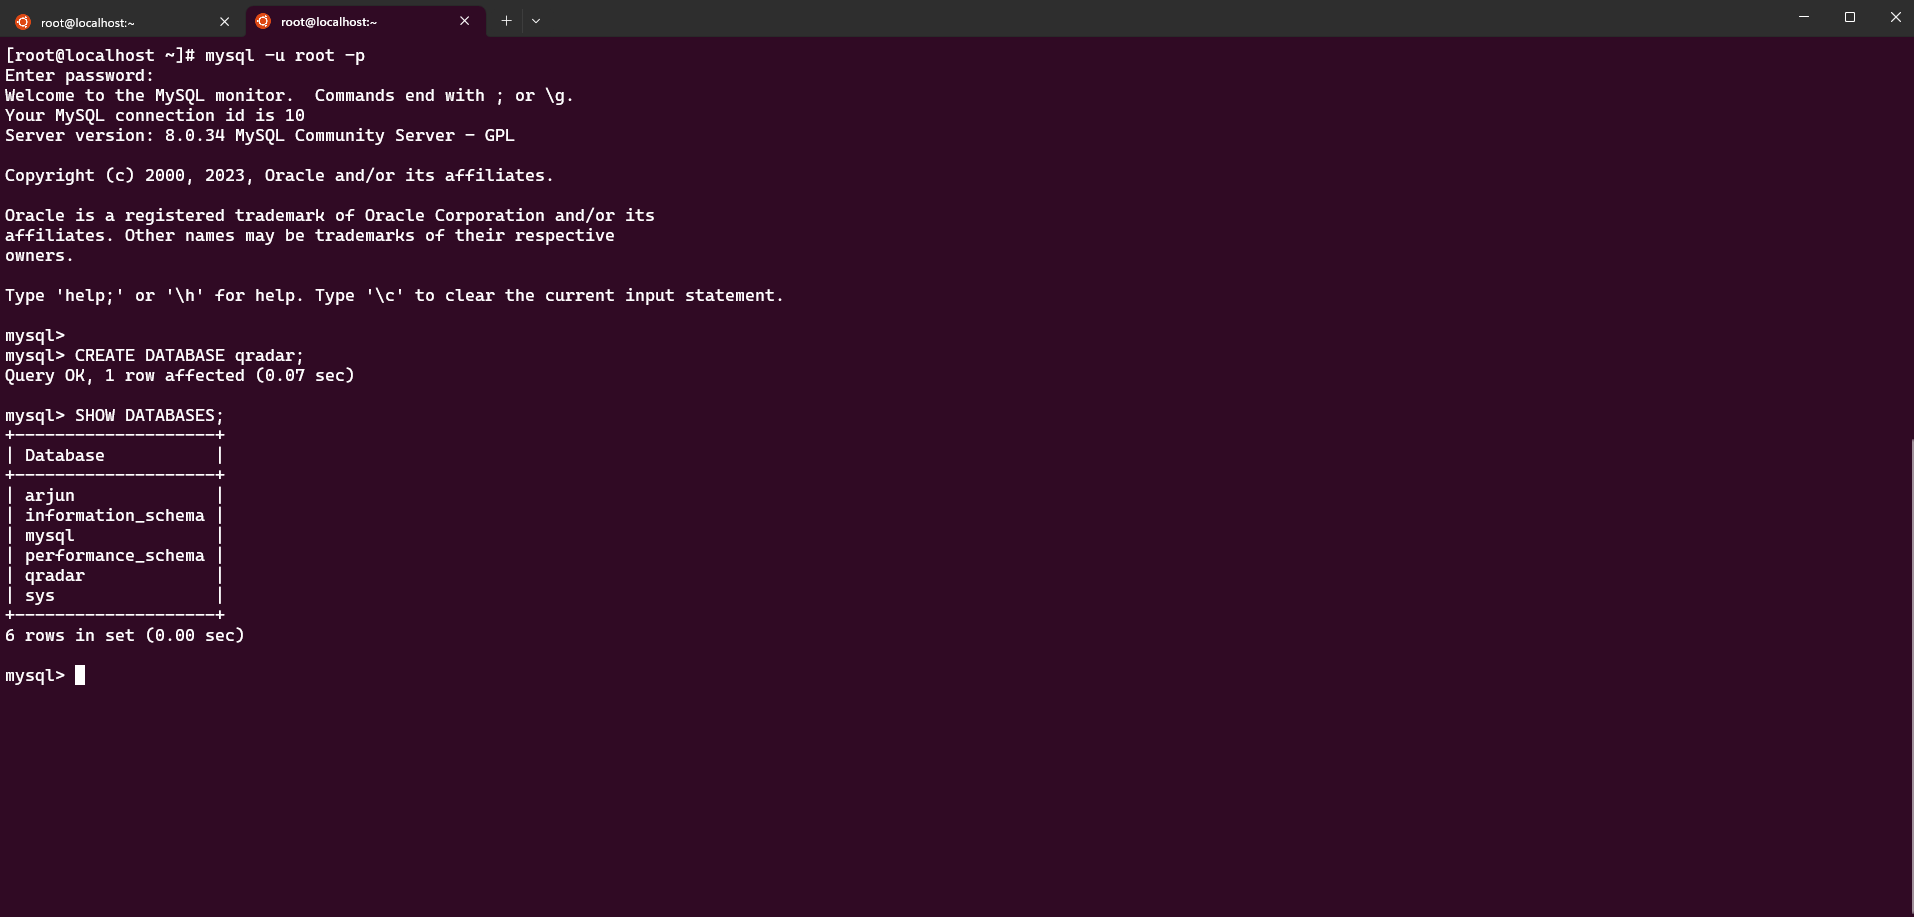
Create a new database called qradar using the command: CREATE DATABASE qradar;
Note: Use the
SHOW DATABASEScommand to view the existing databases on MySQL.
Now that we have created the database on MySQL, the next step is to configure it on Metabase.
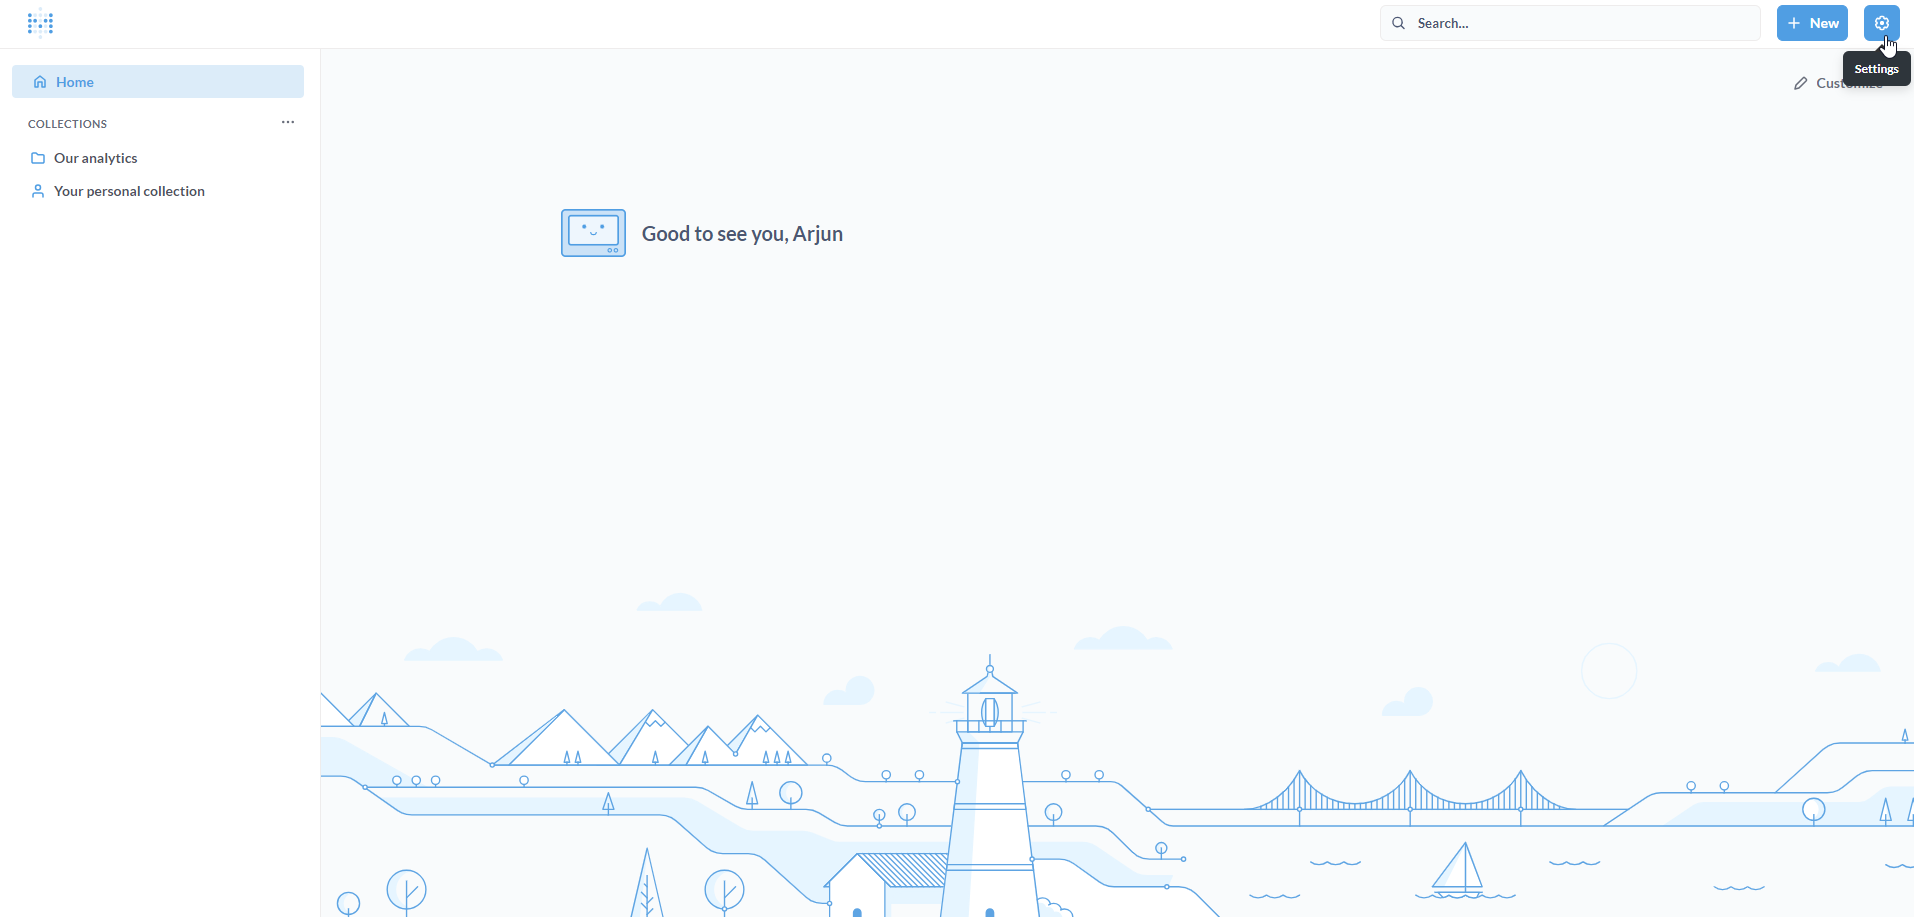
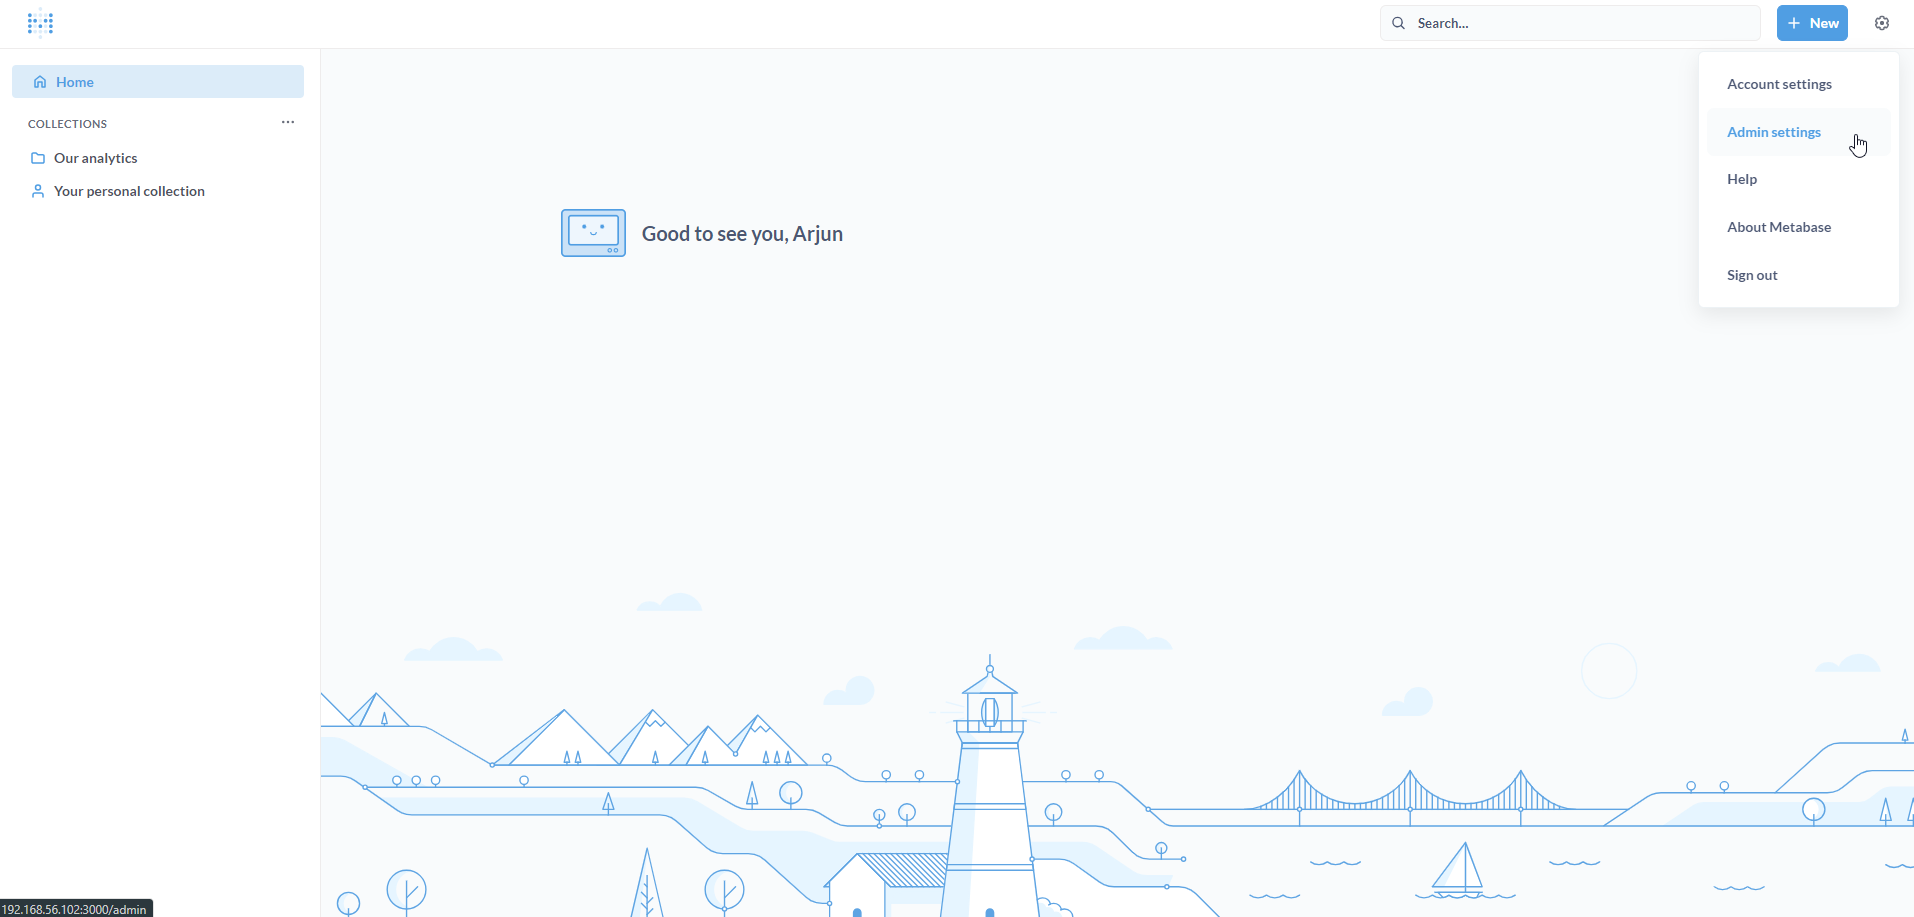
Log in to Metabase. Click on the Settings icon on the top-right to open the Settings menu.
Click on Admin settings.
On the Admin settings page, click on the Databases tab.
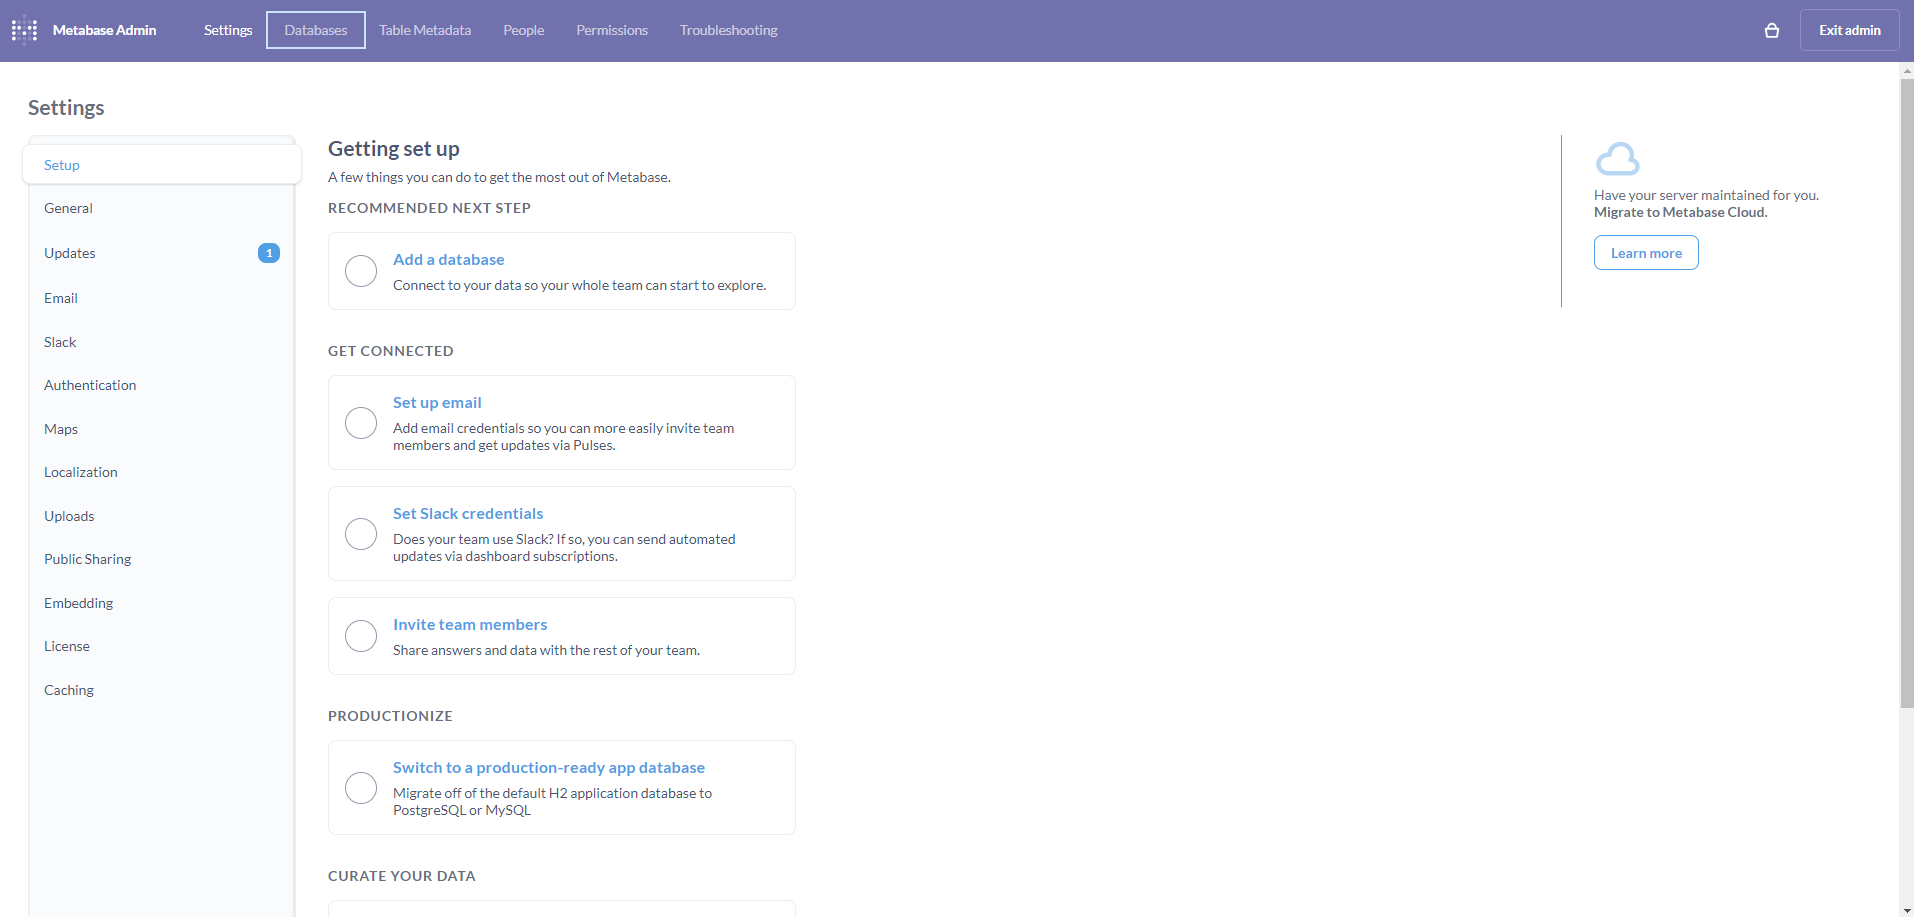
On the Databases page, click on Add database.
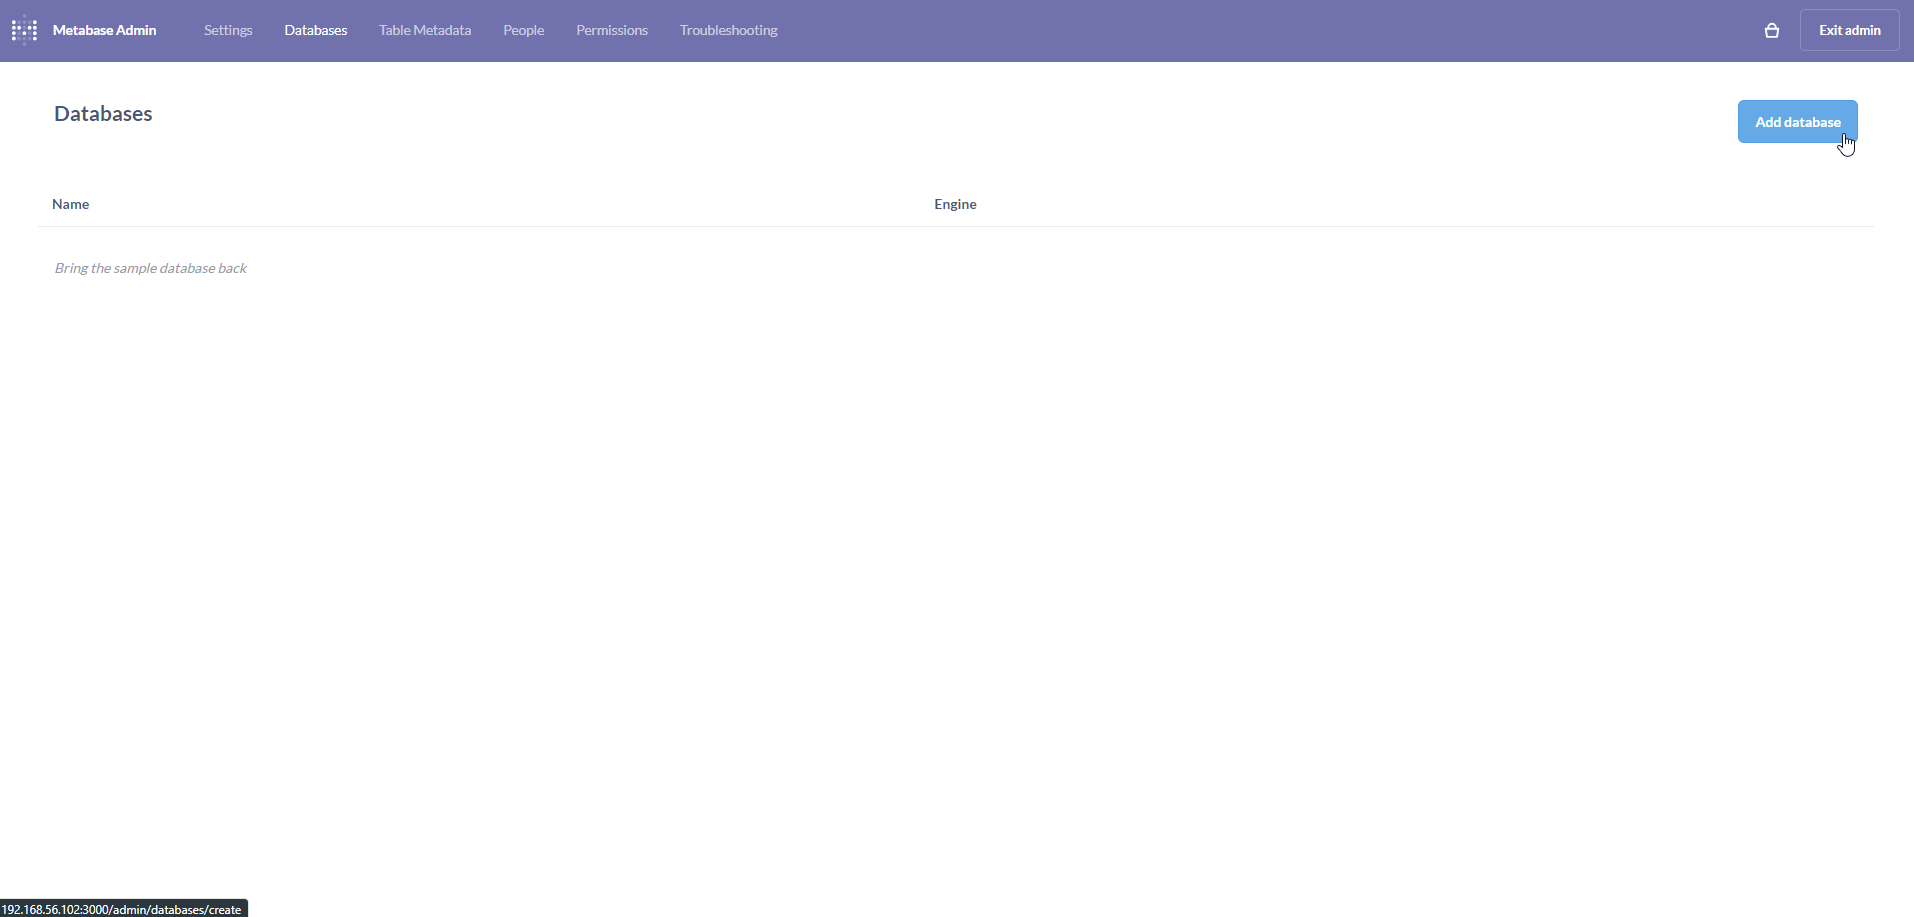
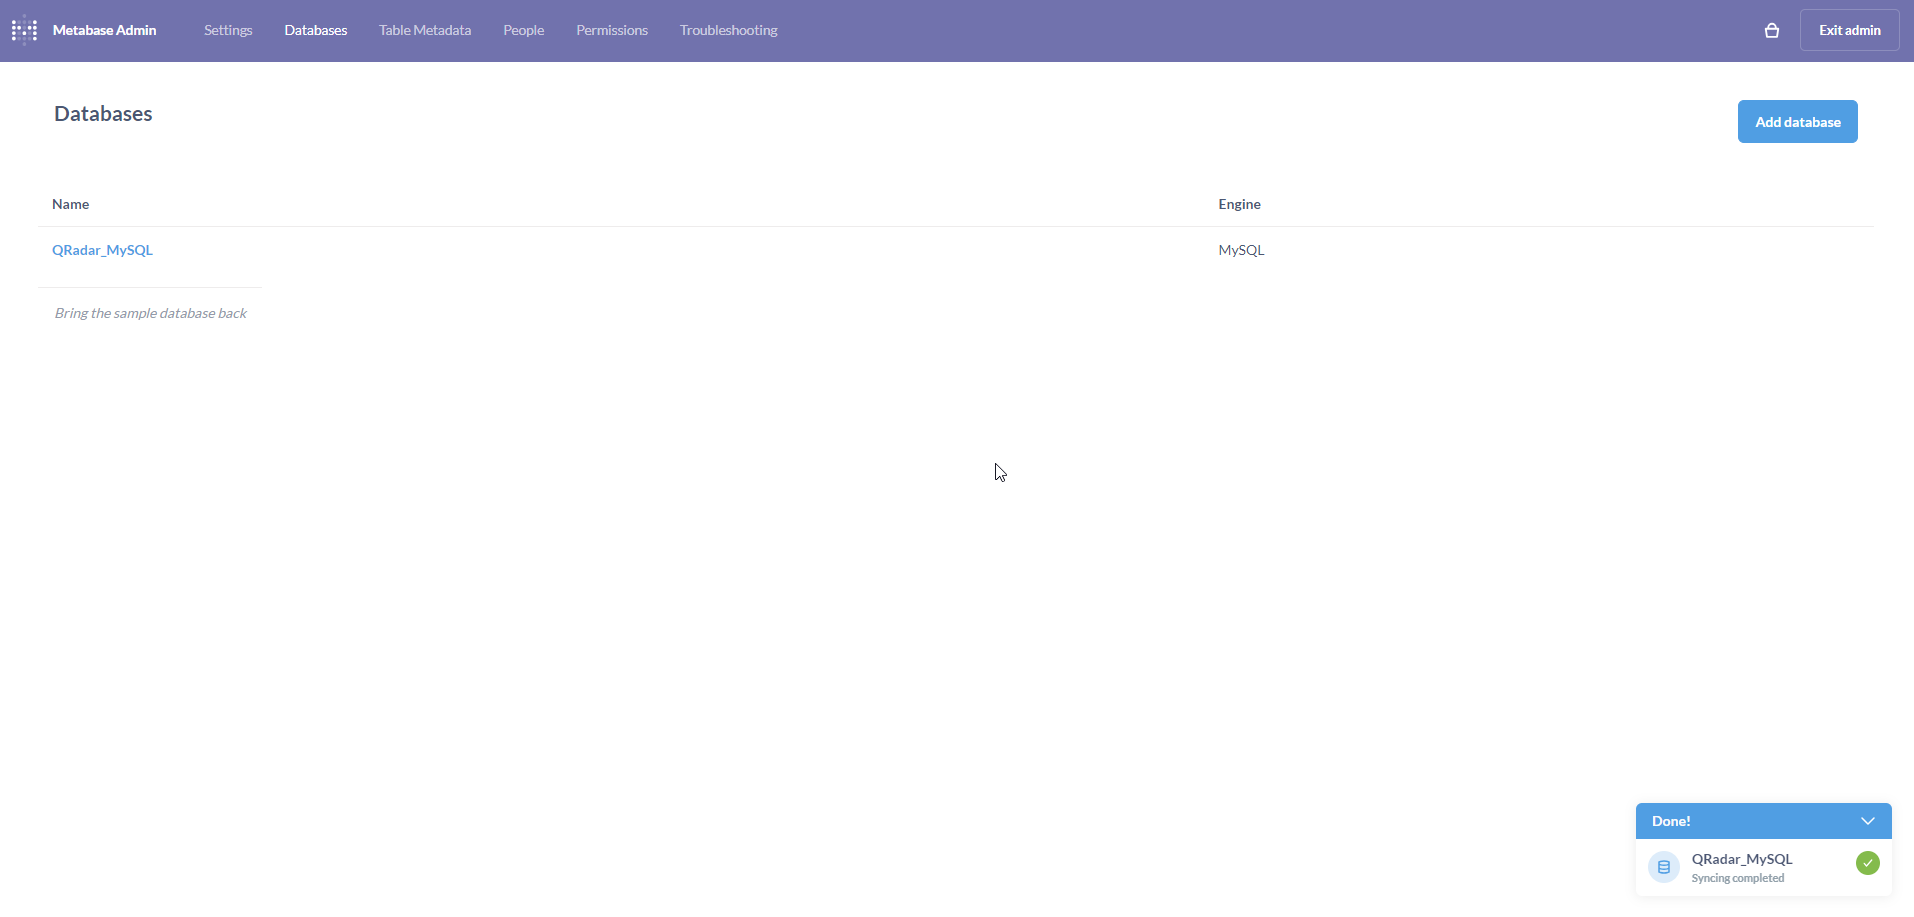
On the Add databases page, populate the form with connection details to the MySQL database. Click on Save.
Note: It is pertinent to ensure that the connection details are accurate. We have used
127.0.0.1since MySQL and Metabase are on the same CentOS 7 Linux VM. Depending on your setup, you may need to add/modify firewall rules to ensure connectivity.

If all goes well, a pop-up will appear on the bottom-right indicating that the database was added and synced successfully.
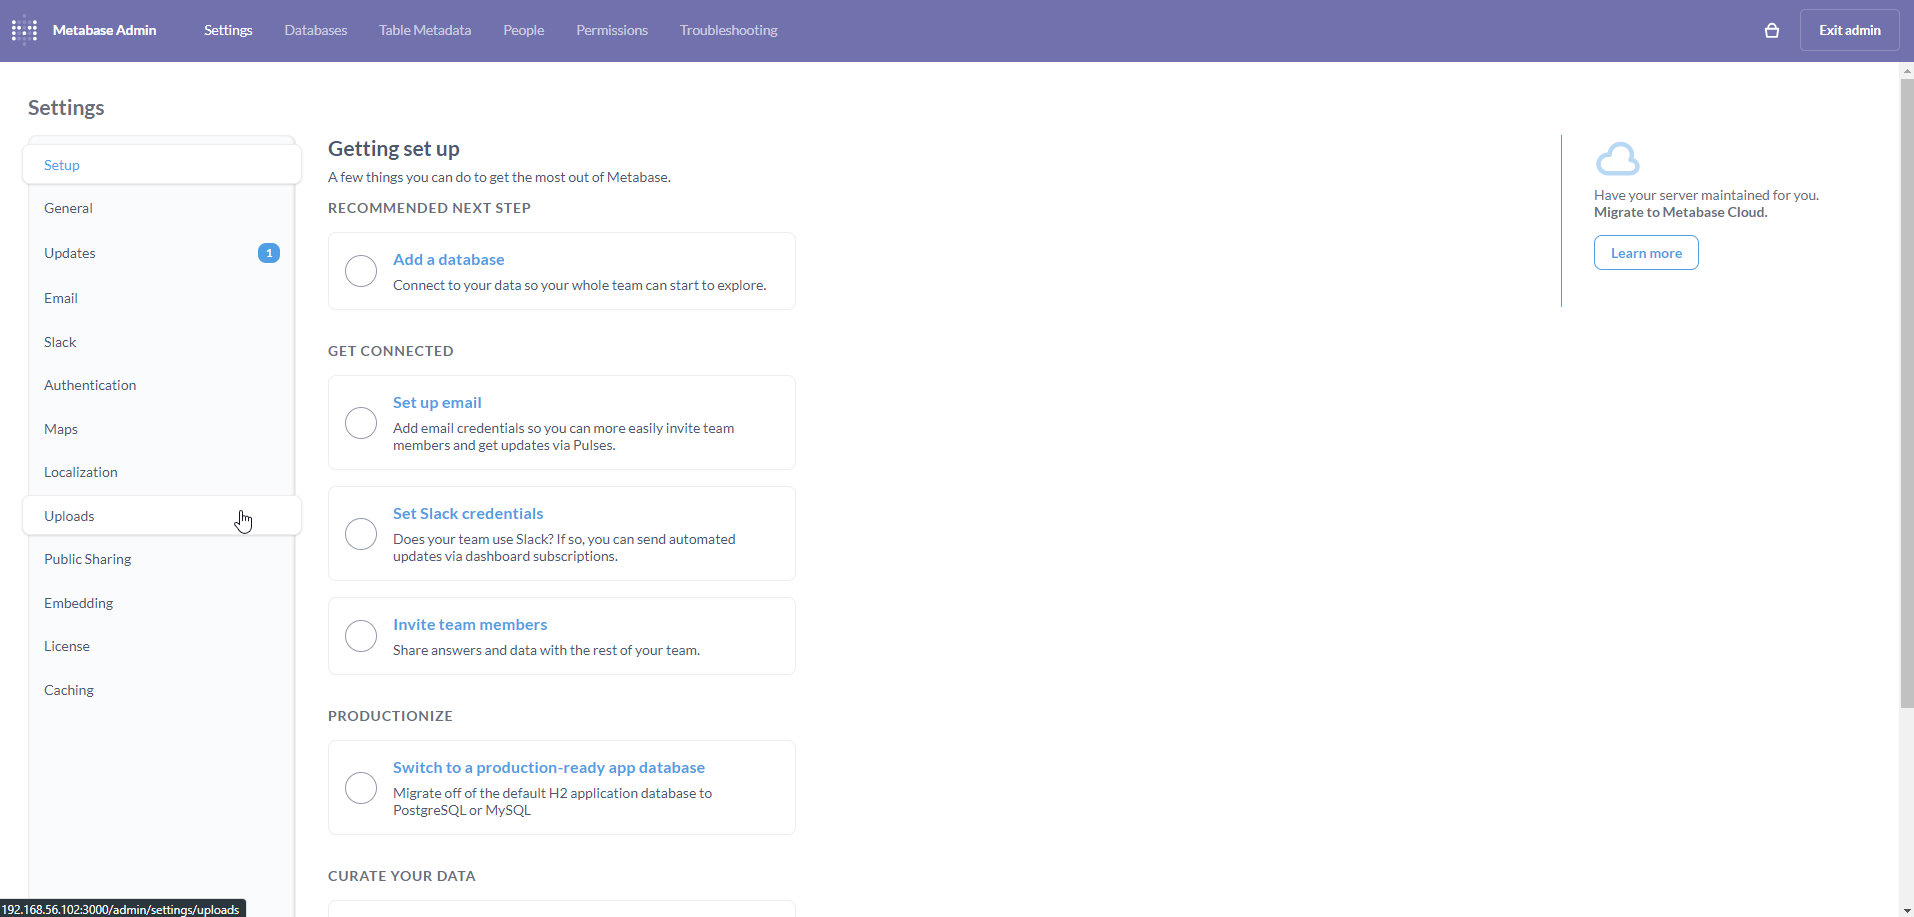
Configuring CSV Uploads on Metabase
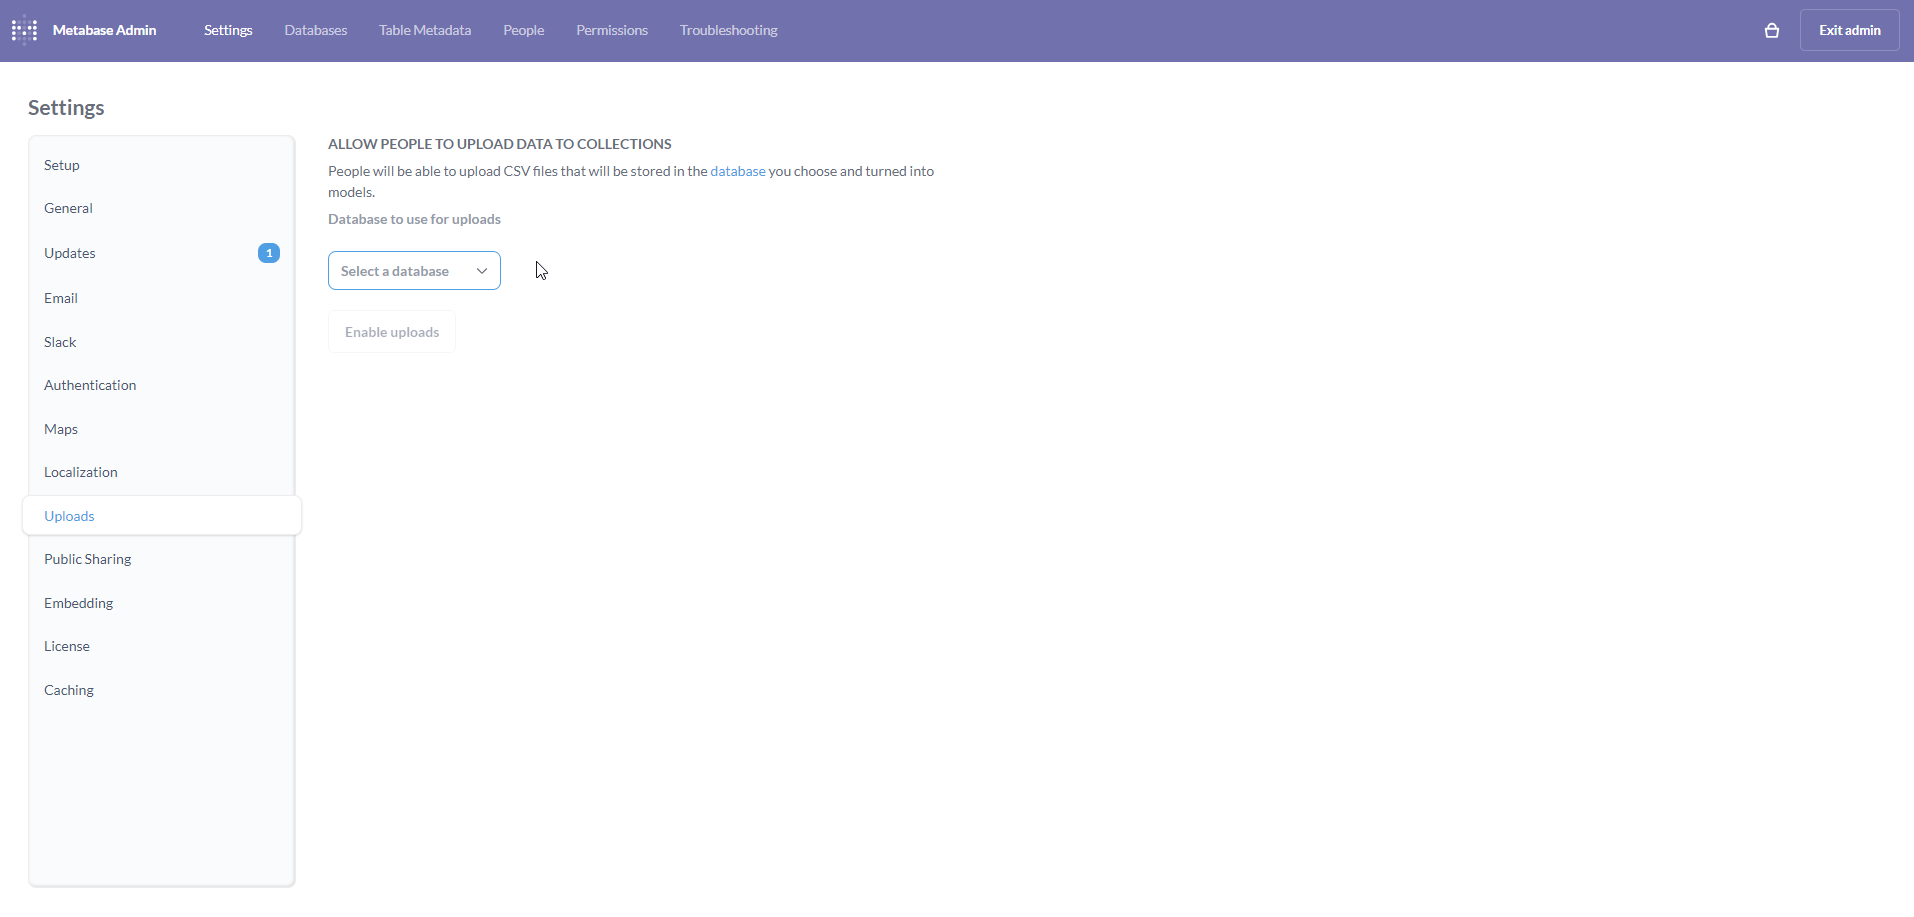
Navigate back to the Admin settings page. Click on the Uploads tab on the left.
On the Uploads page, click on the Select a database dropdown.
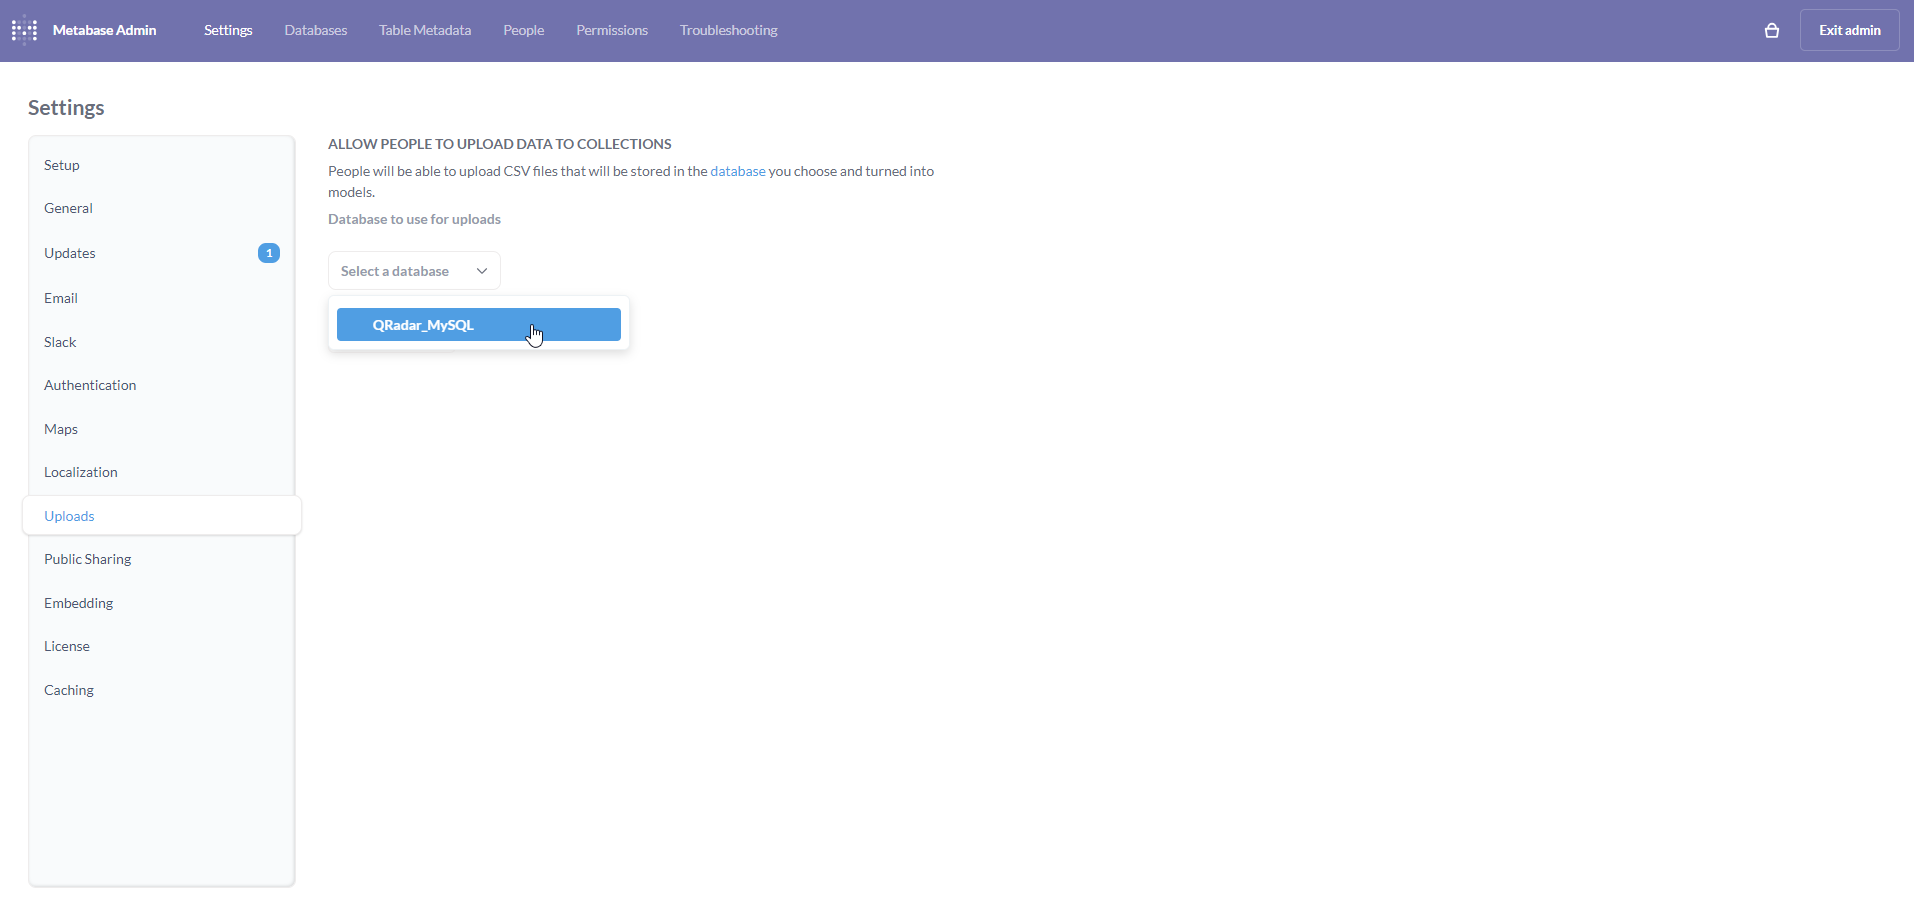
Select QRadar_MySQL from the dropdown.
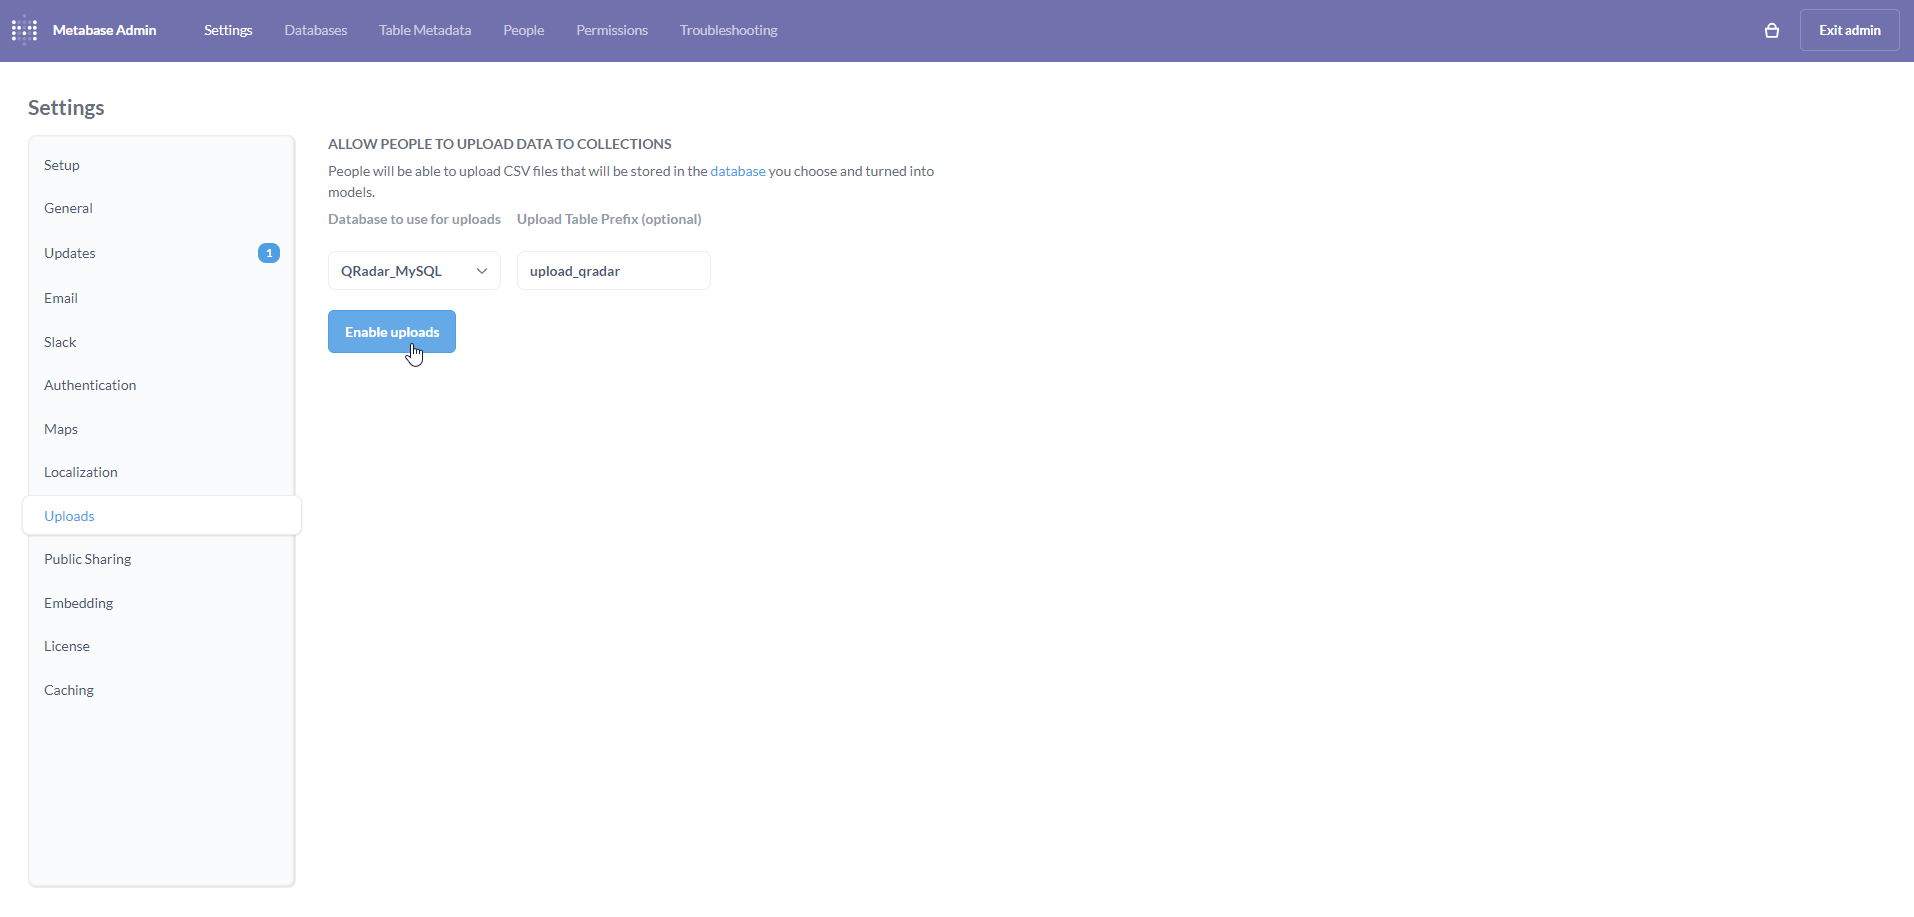
Once selected, an input box titled Upload Table Prefix (optional) will appear. Although it is optional, I have appended qradar for the sake of this tutorial. The Enable uploads button will now be enabled. Click on the button.
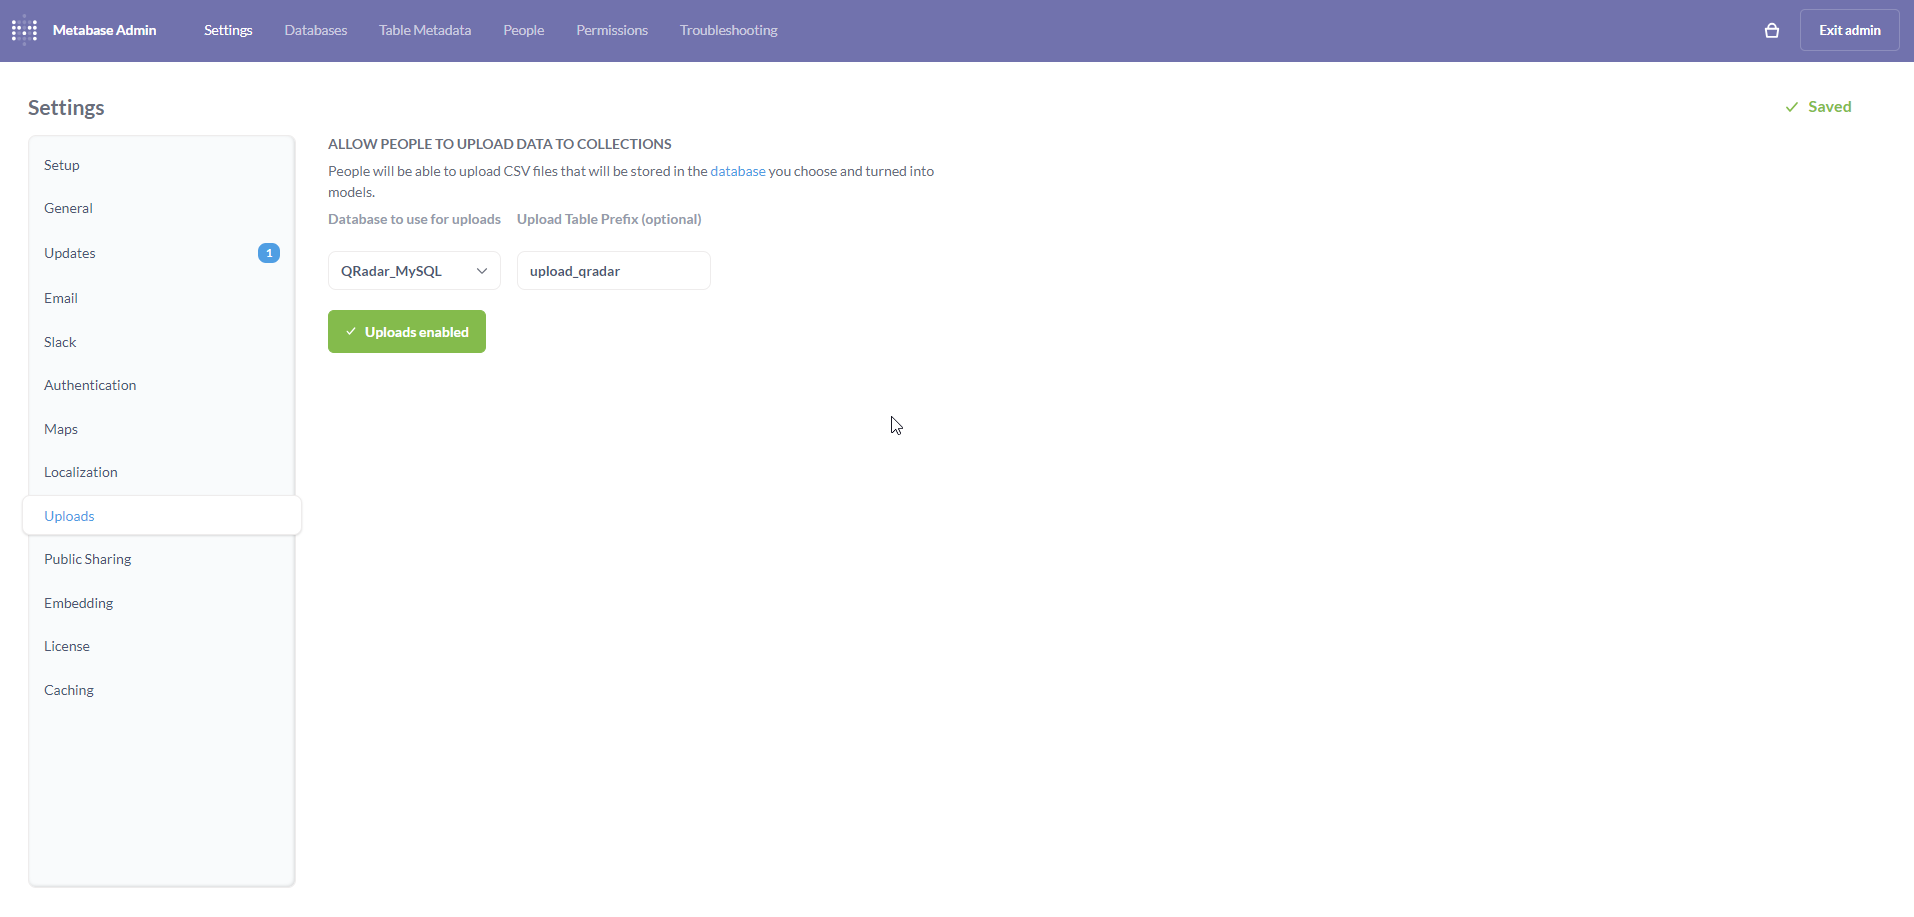
If all goes well, the button will turn green and display Uploads enabled. Exit the Admin settings page by clicking on Exit admin on the top-right.
Uploading CSVs to Metabase
The next step involves uploading the QRadar Offenses CSV to Metabase.
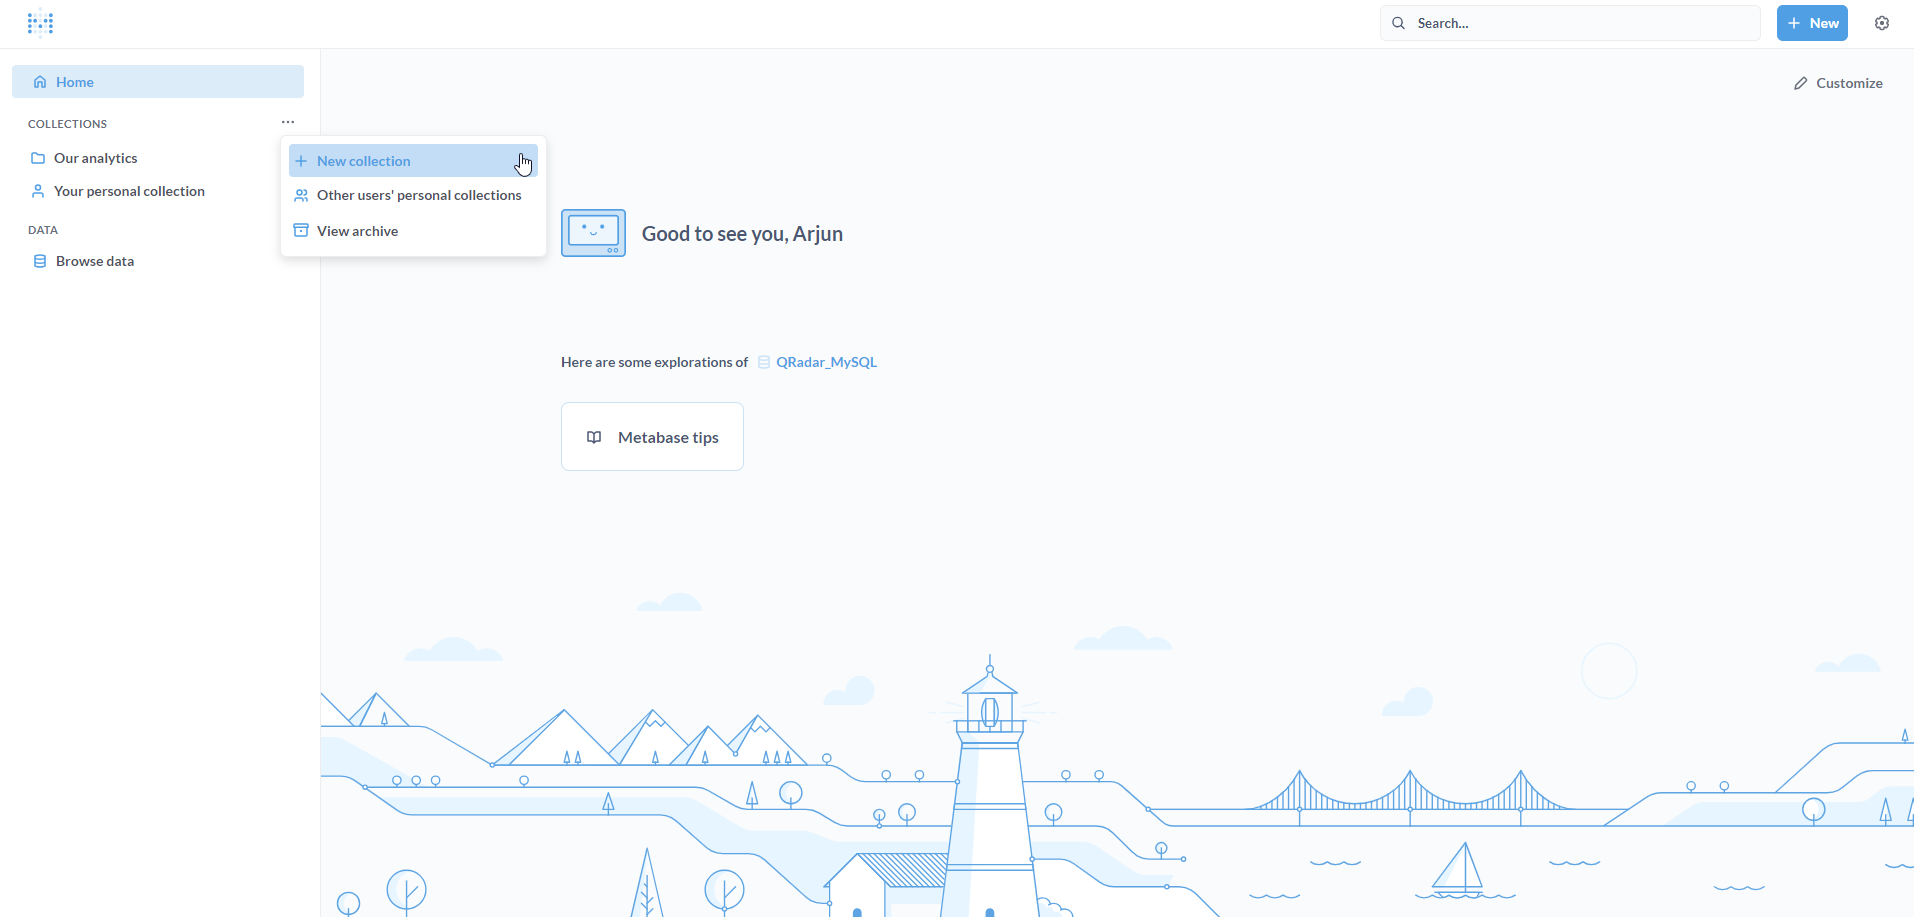
Navigate to the Metabase home page. Click on the meatballs menu (yes, it’s actually called meatballs menu) next to COLLECTIONS. Click on + New collection.
According to Metabase documentation:
Collections are the main way to organize questions, dashboards, and models. You can think of them like folders or directories. You can nest collections in other collections, and move collections around. One thing to note is that a single item, like a question or dashboard, can only be in one collection at a time (excluding parent collections).
Populate the New collection form with a Name and an optional Description. Click on Create.
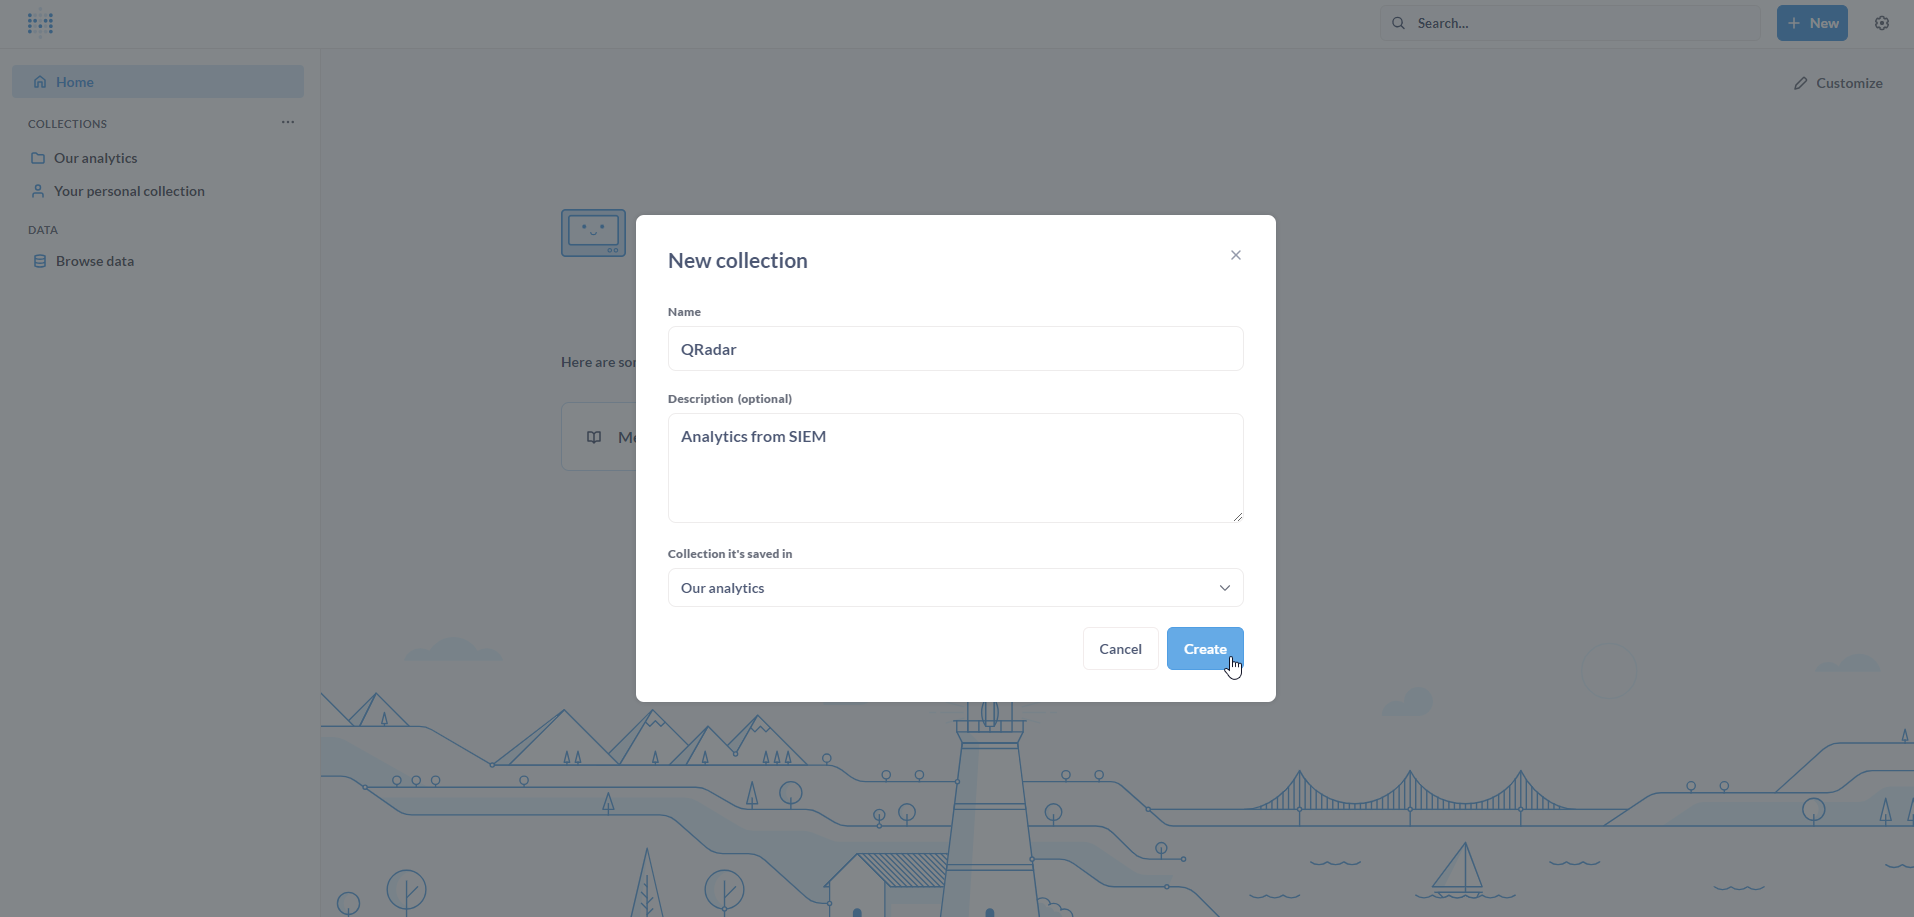
The new collection is created. It is empty and is ready to be filled with Questions, Dashboards, Models, etc.
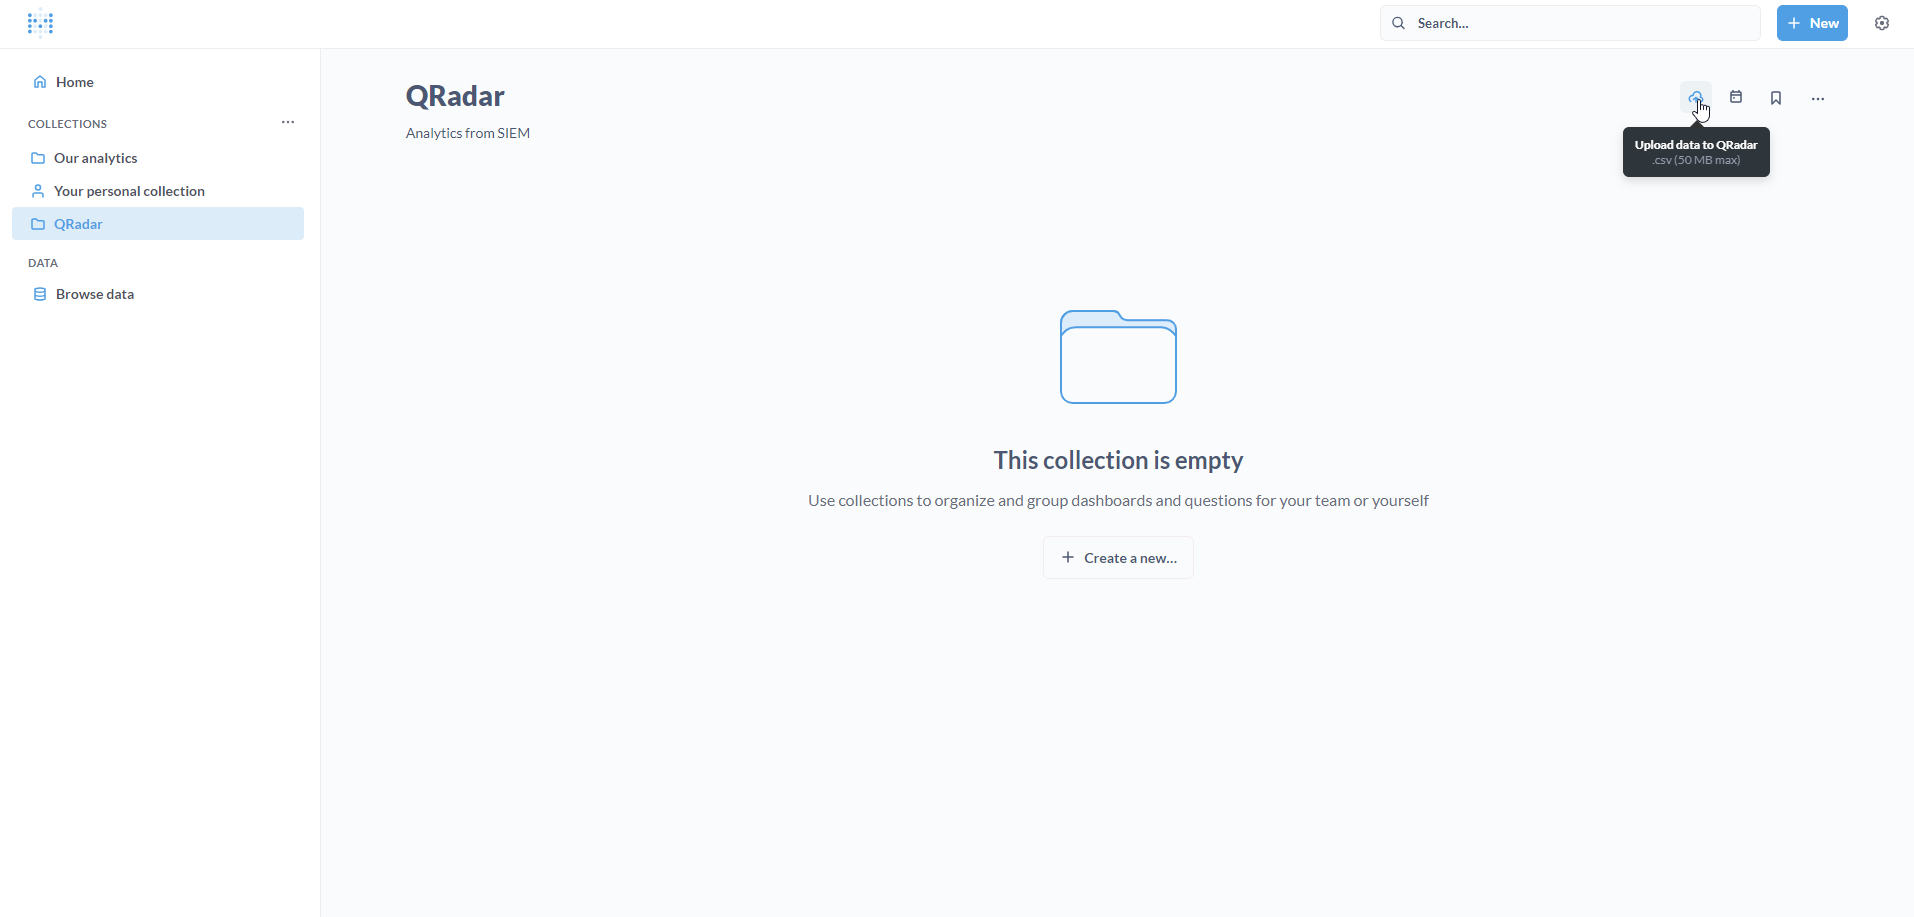
To upload the Offenses CSV file, click on the Upload data to QRadar icon on the top-right.
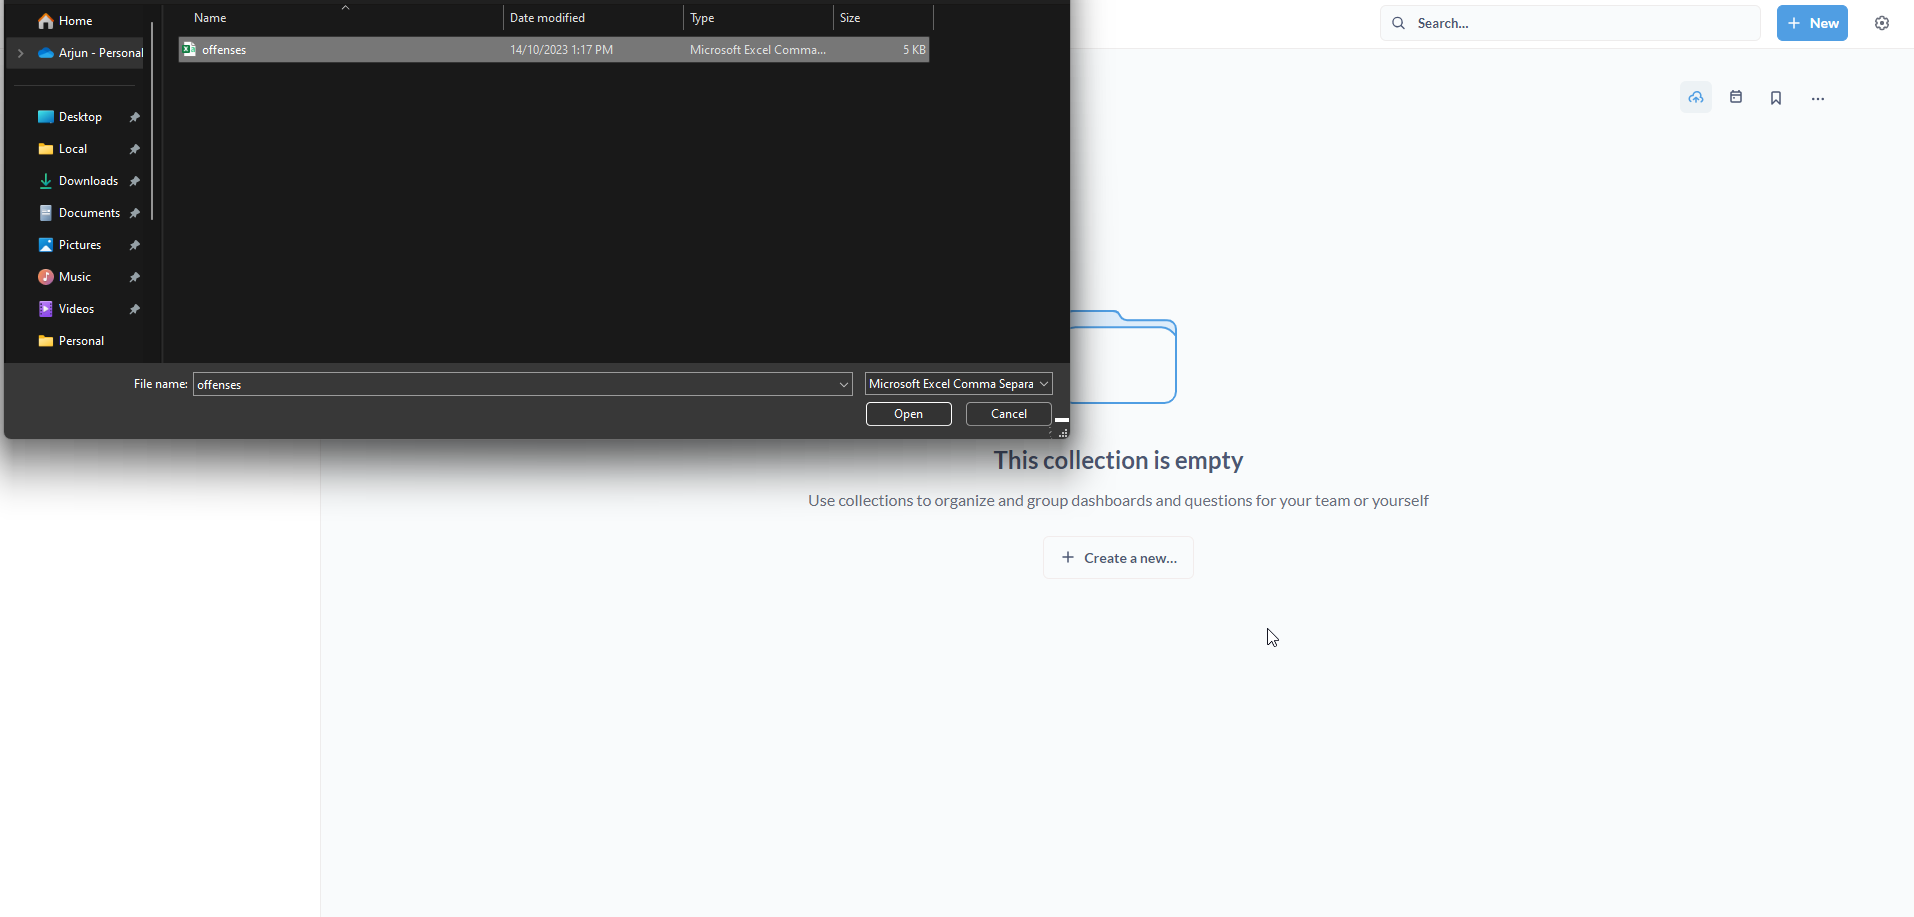
The file browser pop-up will open. Locate and select the offenses CSV file. Click on Open.
If all goes well, a pop-up will appear on the bottom-right indicating that the data was added to the QRadar collection.
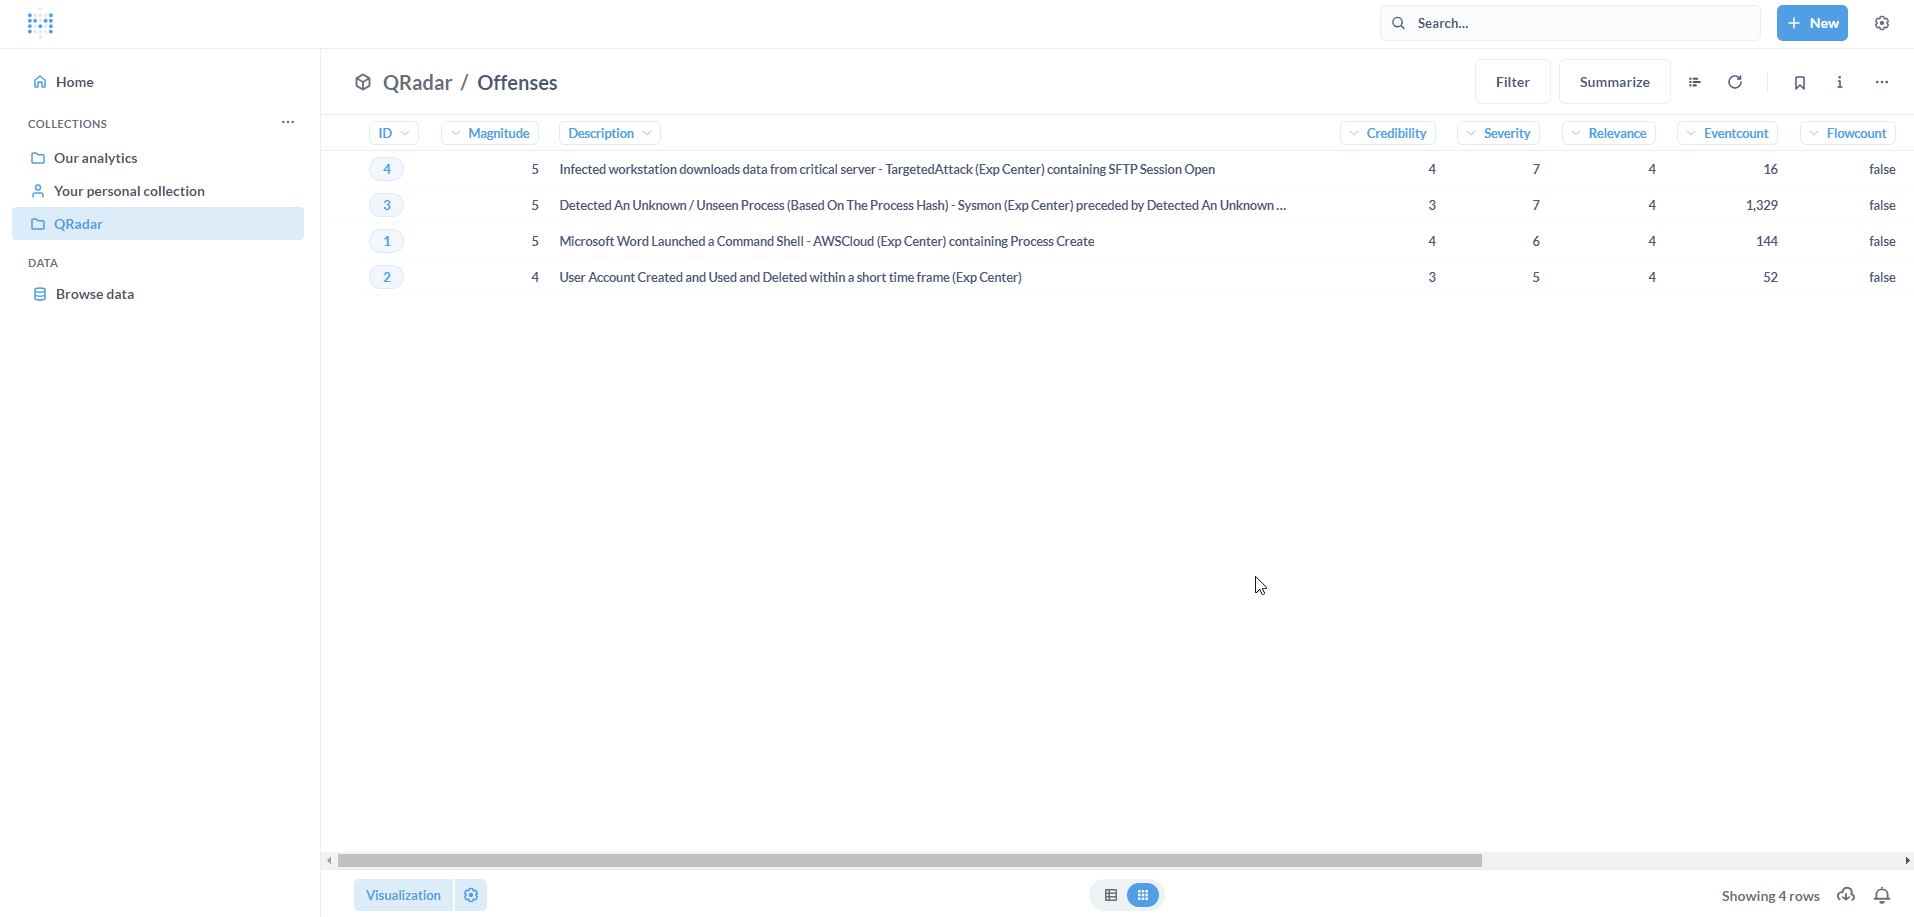
A new Model, titled Offenses, will appear in the Collection. Click on it.
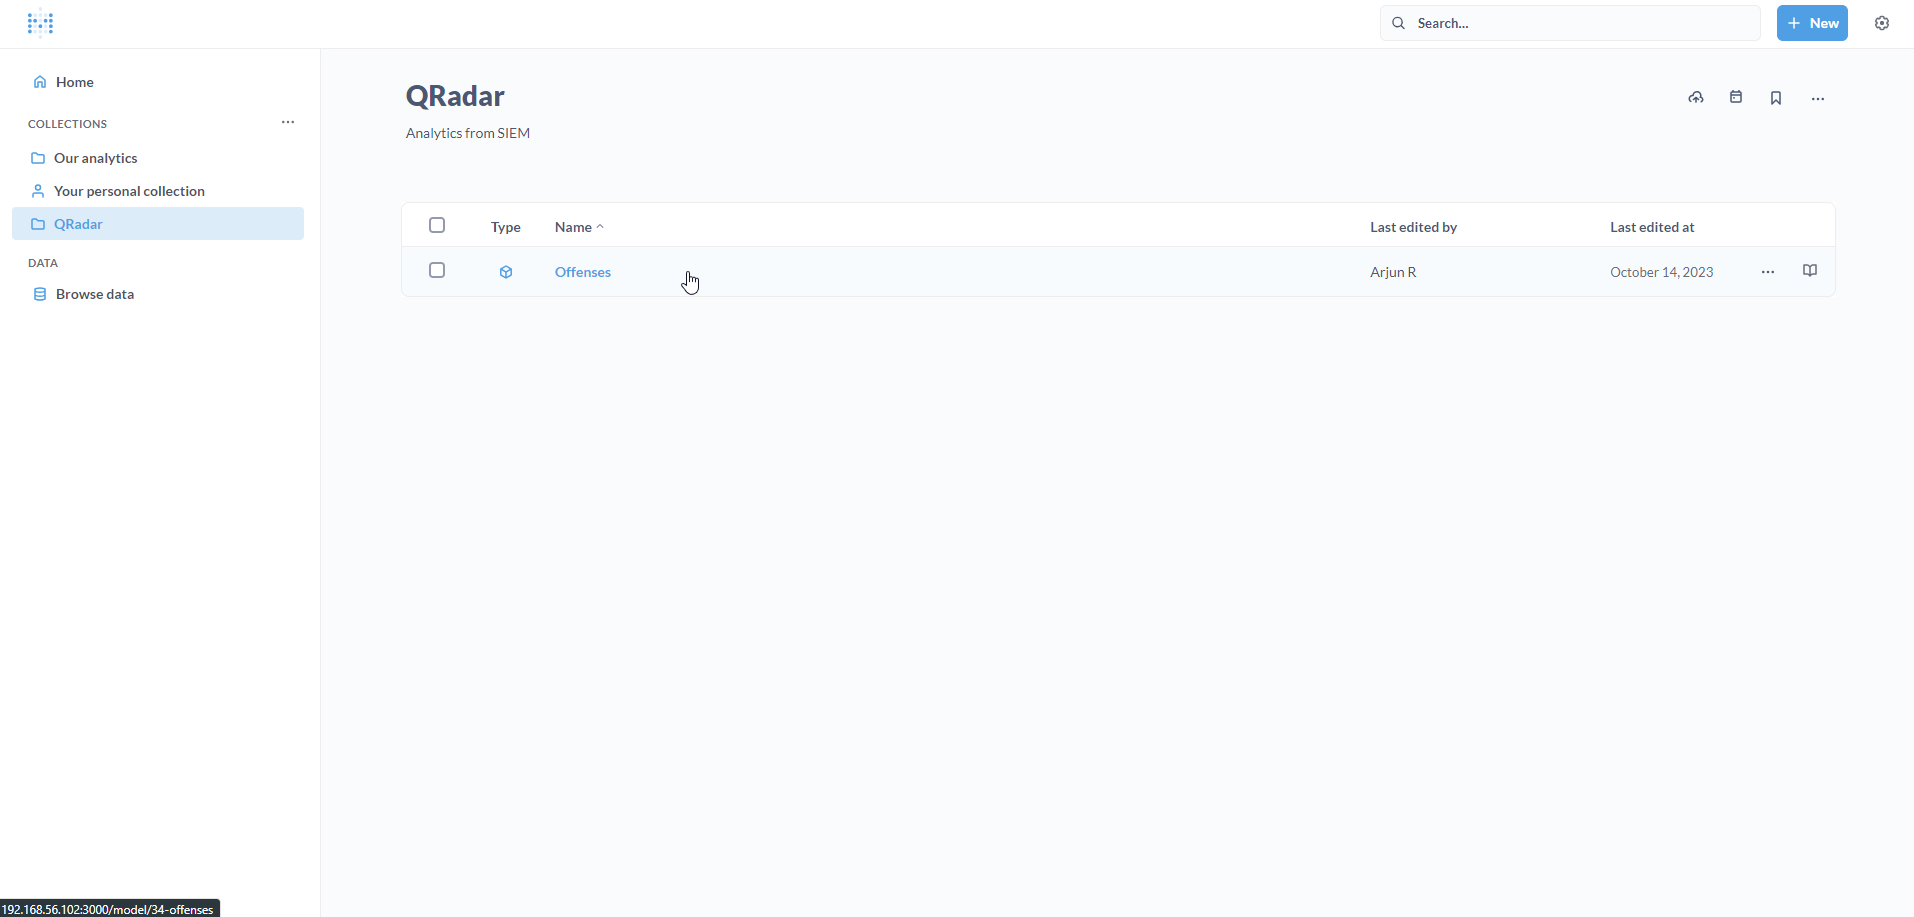
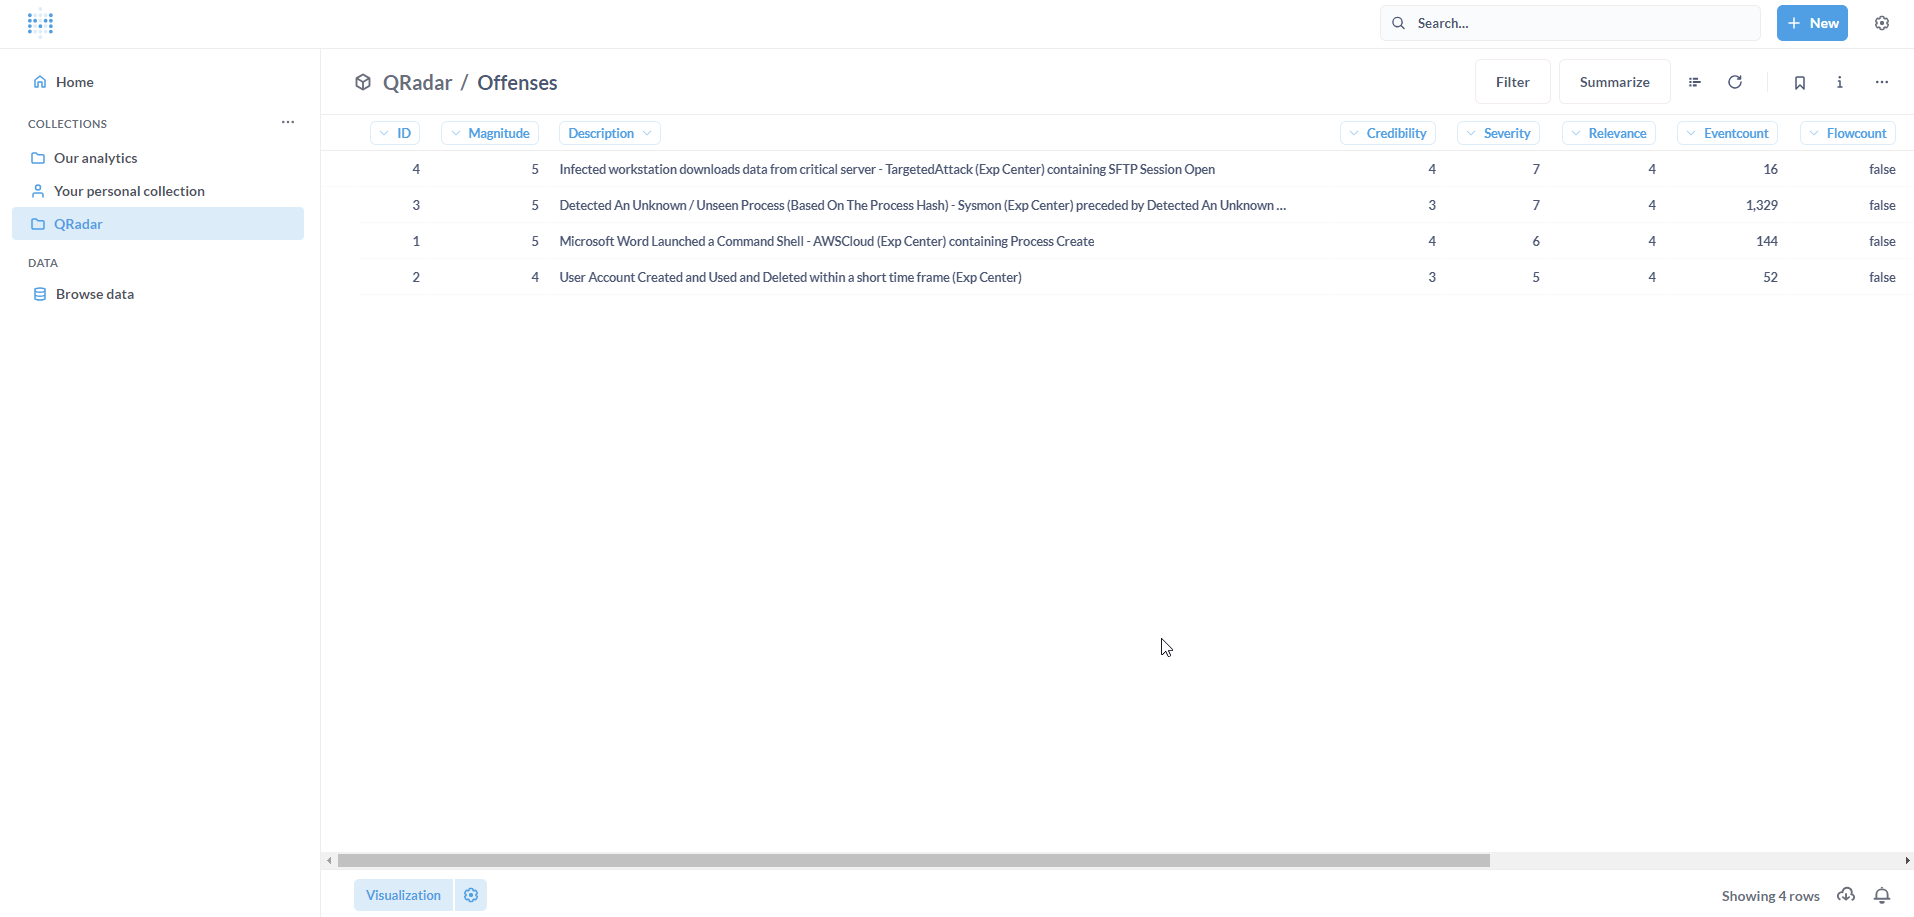
We can see our QRadar Offenses on Metabase. Great!
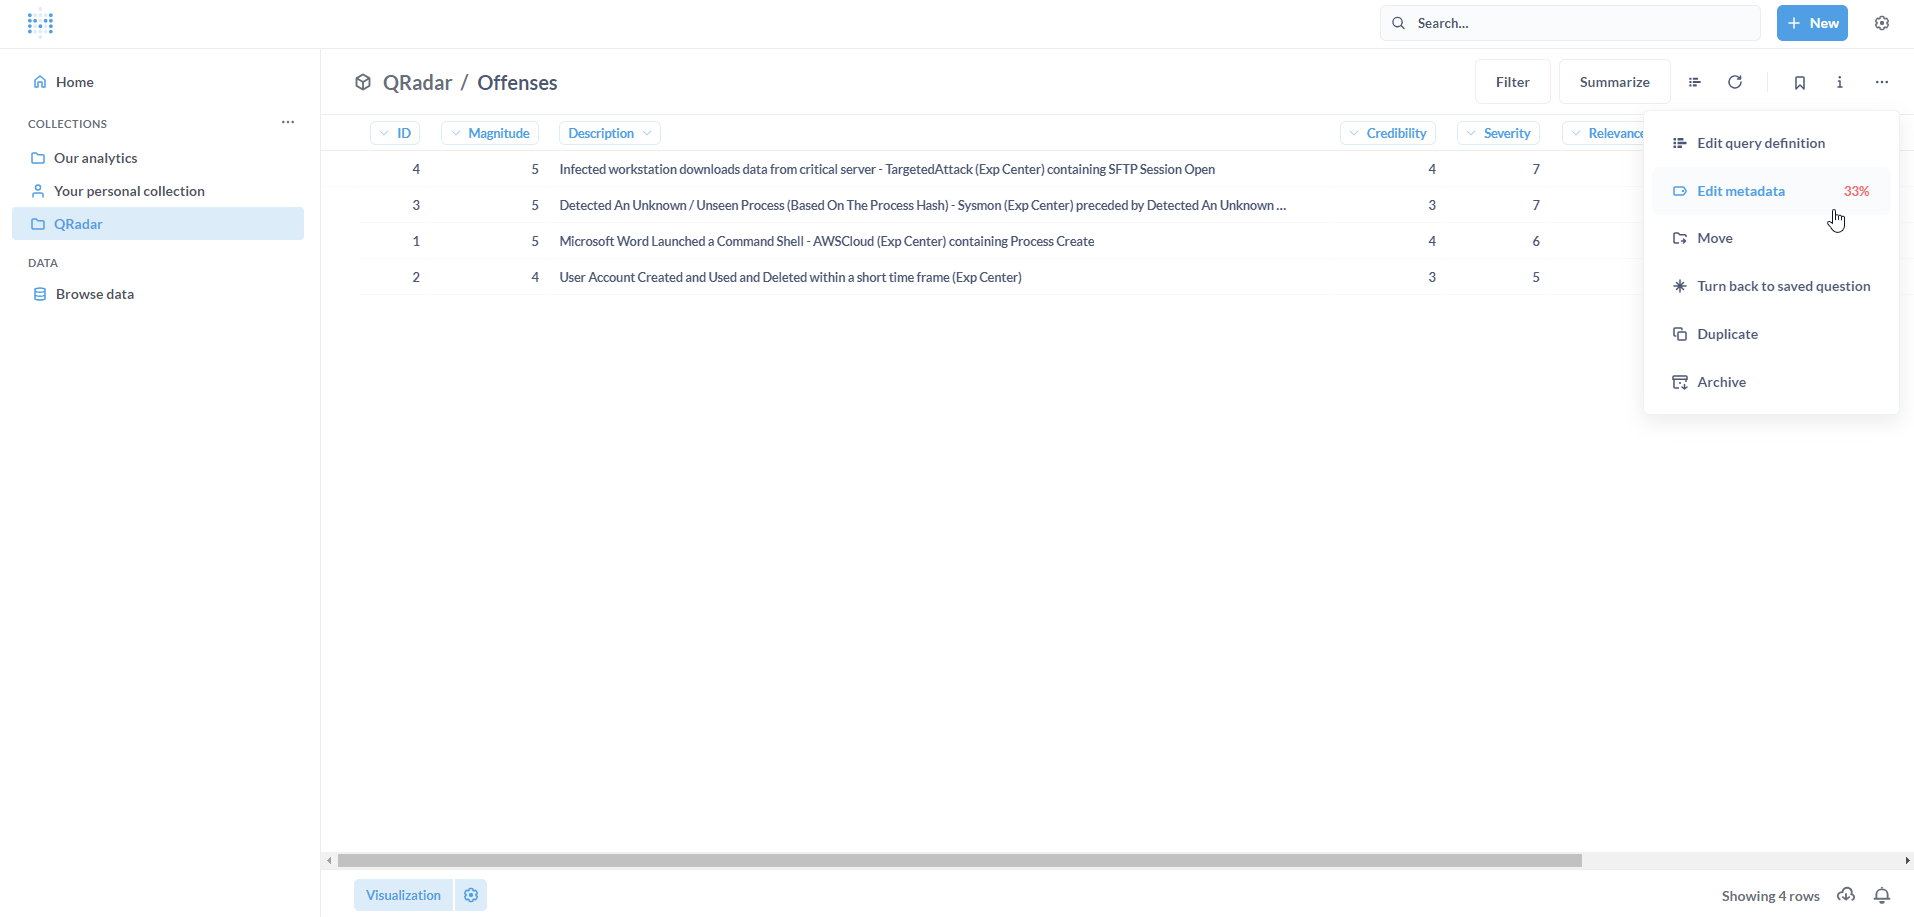
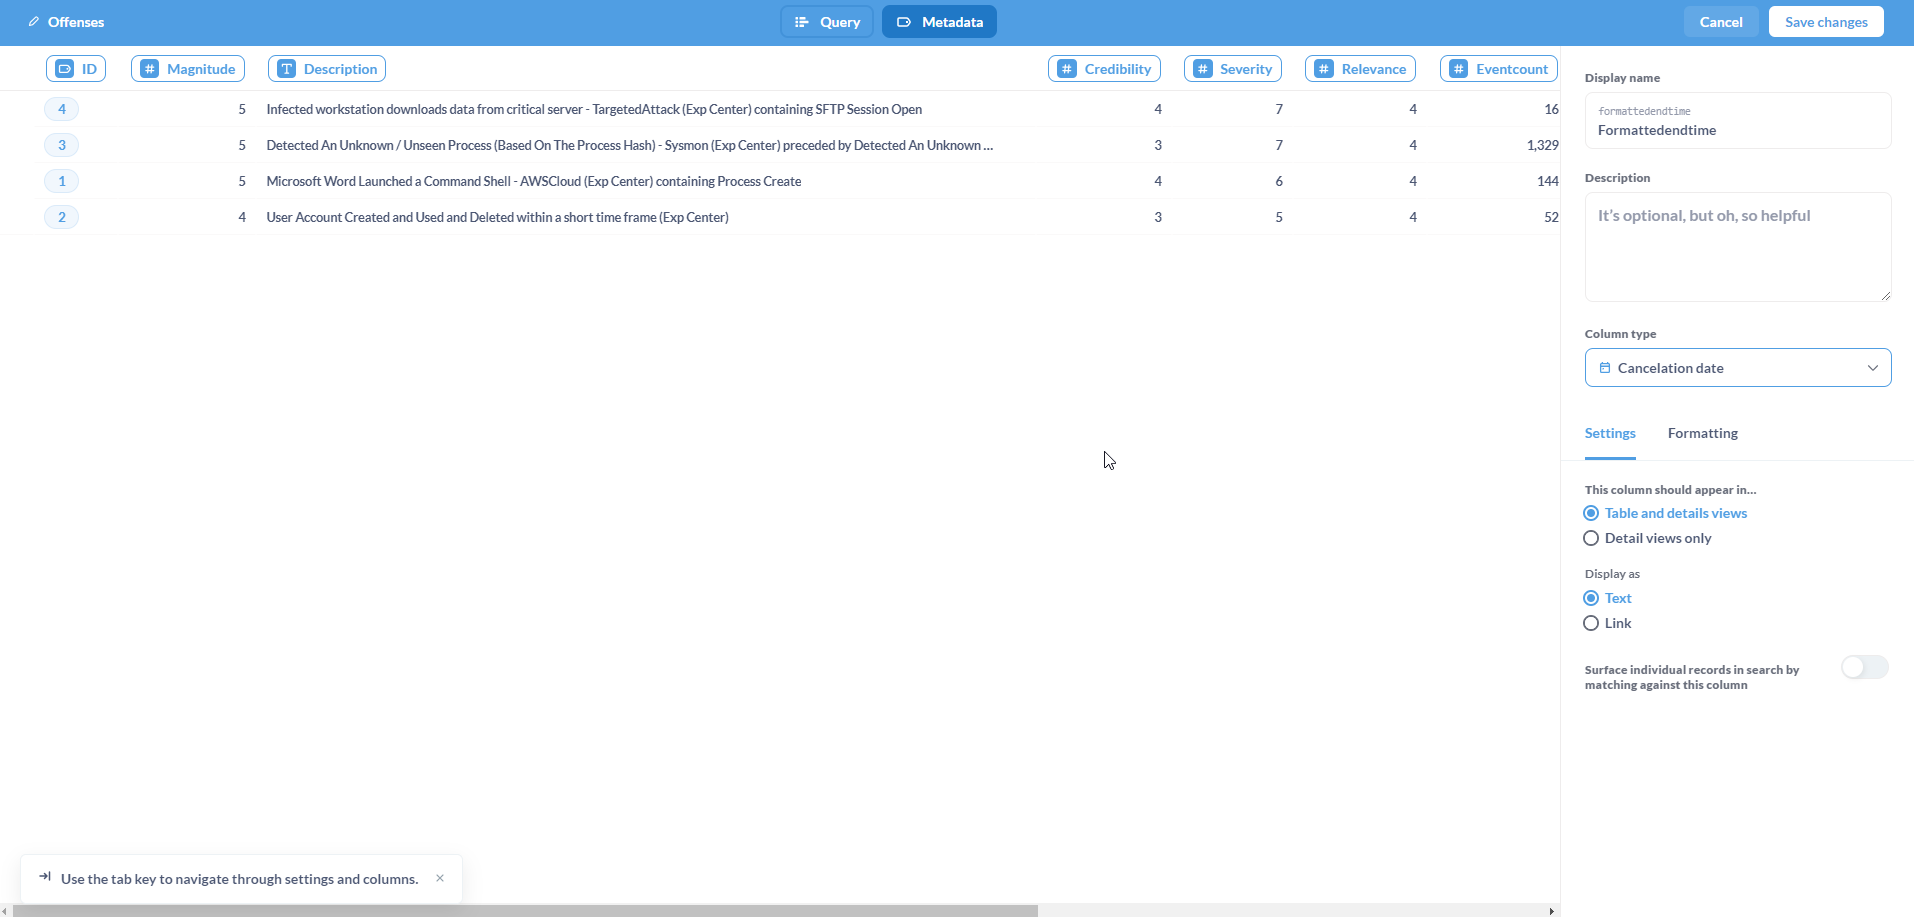
It is pertinent to validate the Model including the column types and formatting before building Dashboards. To delve into the Model, click on the meatballs menu on the right, and click on Edit metadata.
On this page, set the appropriate column type for each column. It is recommended to provide a description for each column to ensure better data governance.
Note: Set the column type for
IDas Entity Key.
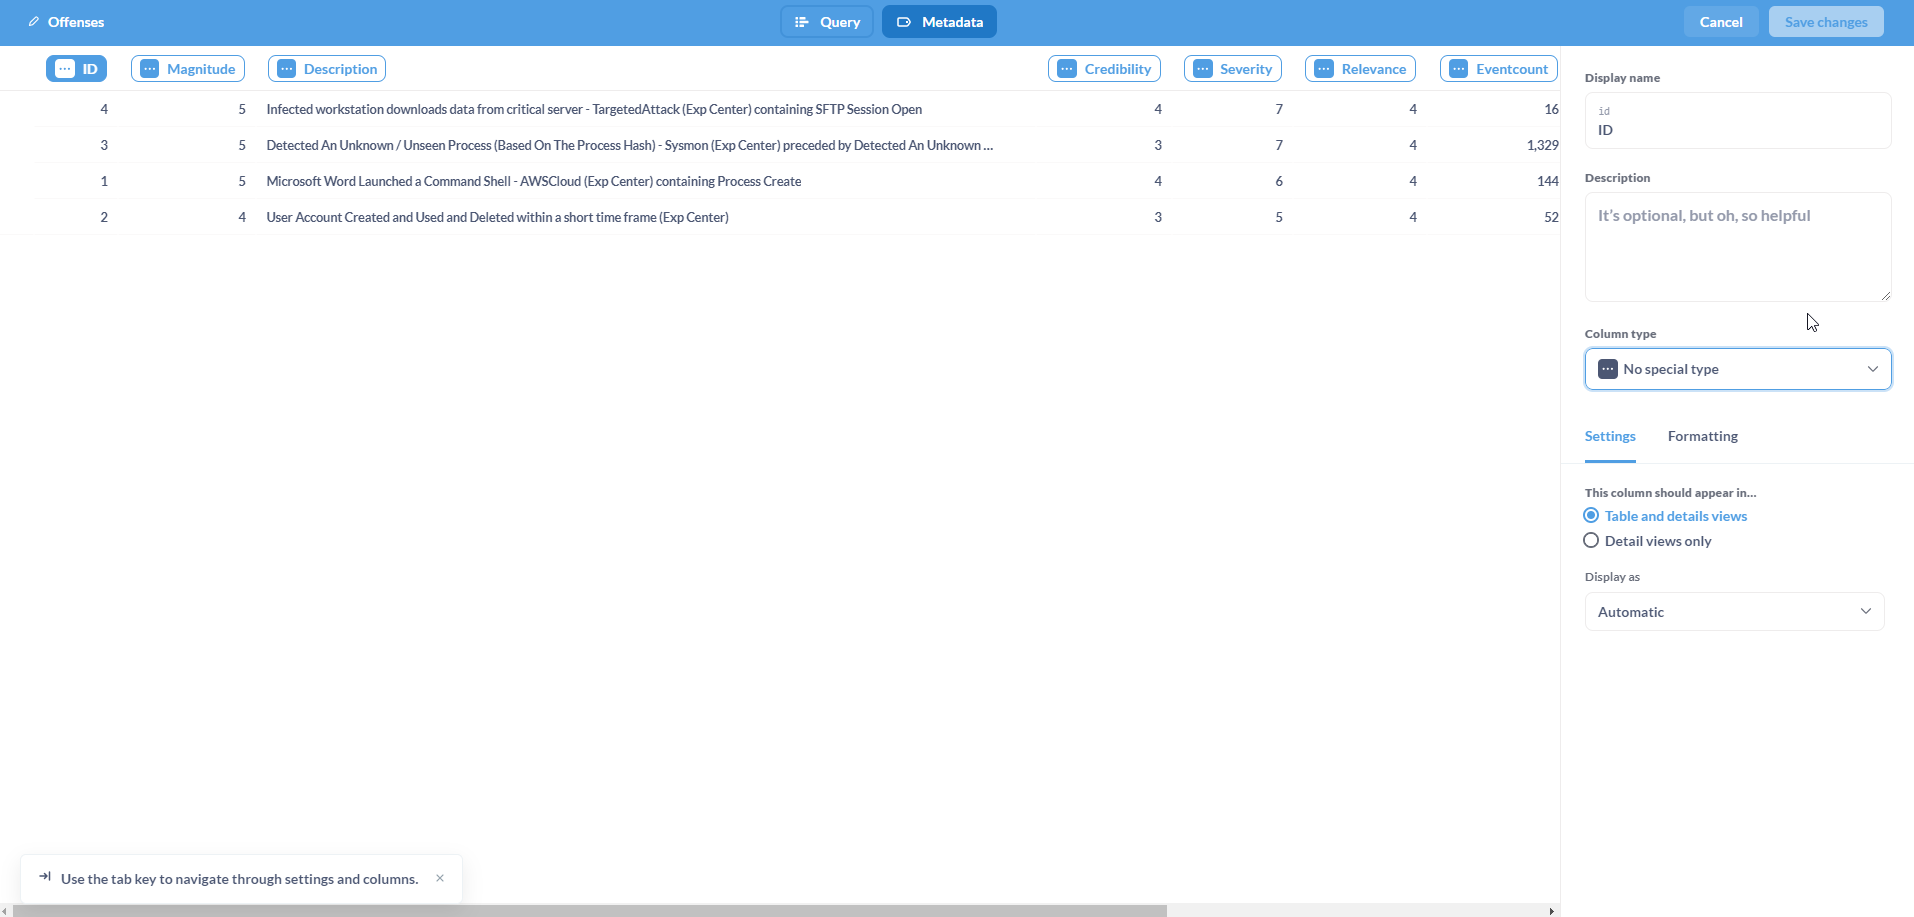
Once completed, click on Save changes.
The updated Model will be loaded.
Questions and Dashboards
The final step involves visualizing Questions and creating a Dashboard on Metabase.
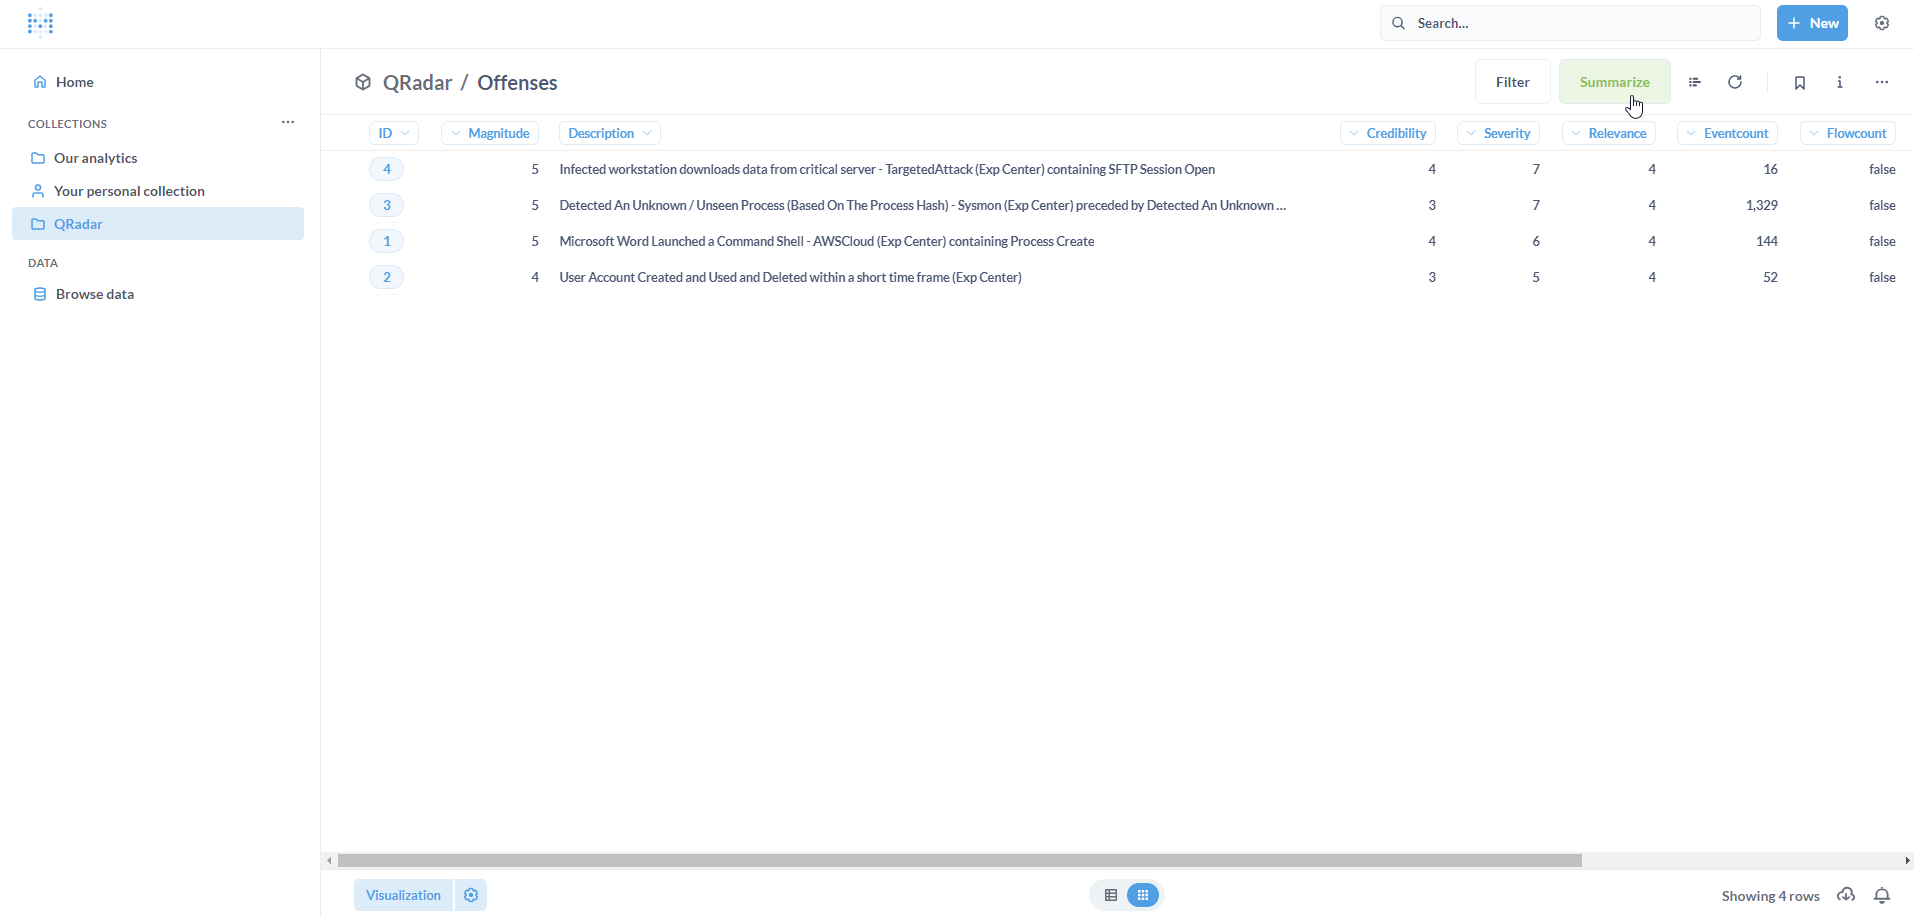
Let us start with a simple metric (Question) - Number of Offenses.
To calculate this, we need to essentially perform a count operation. Click on Summarize.
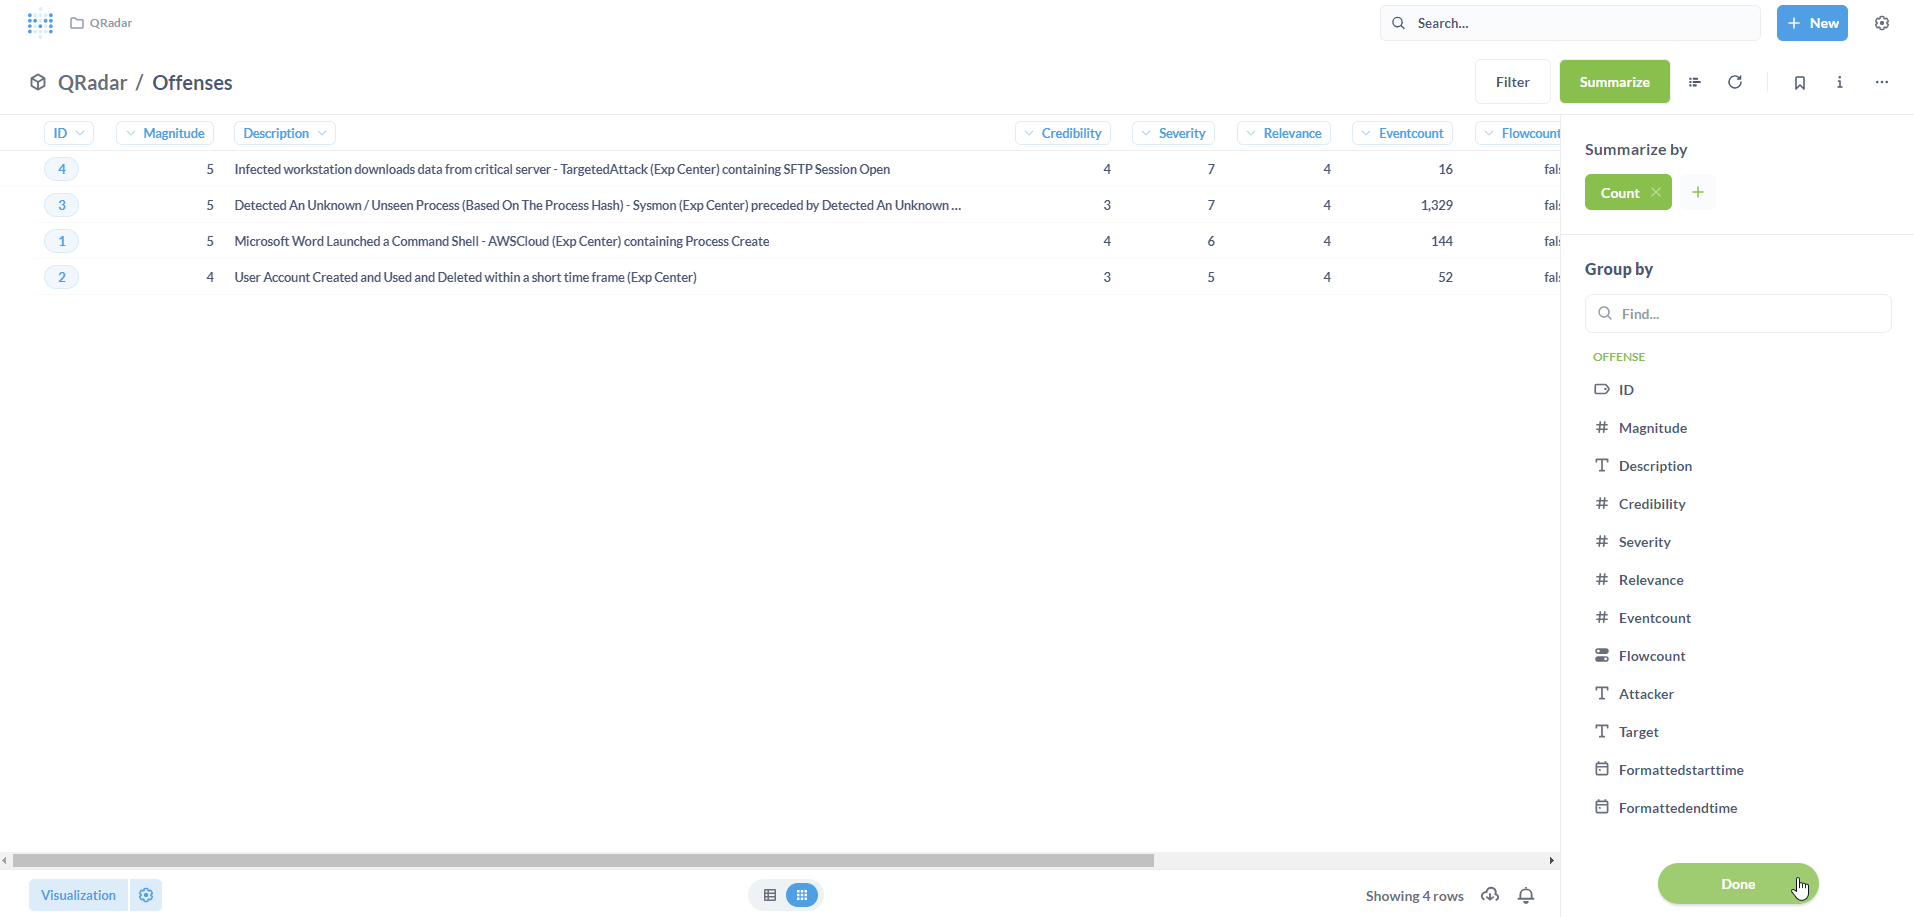
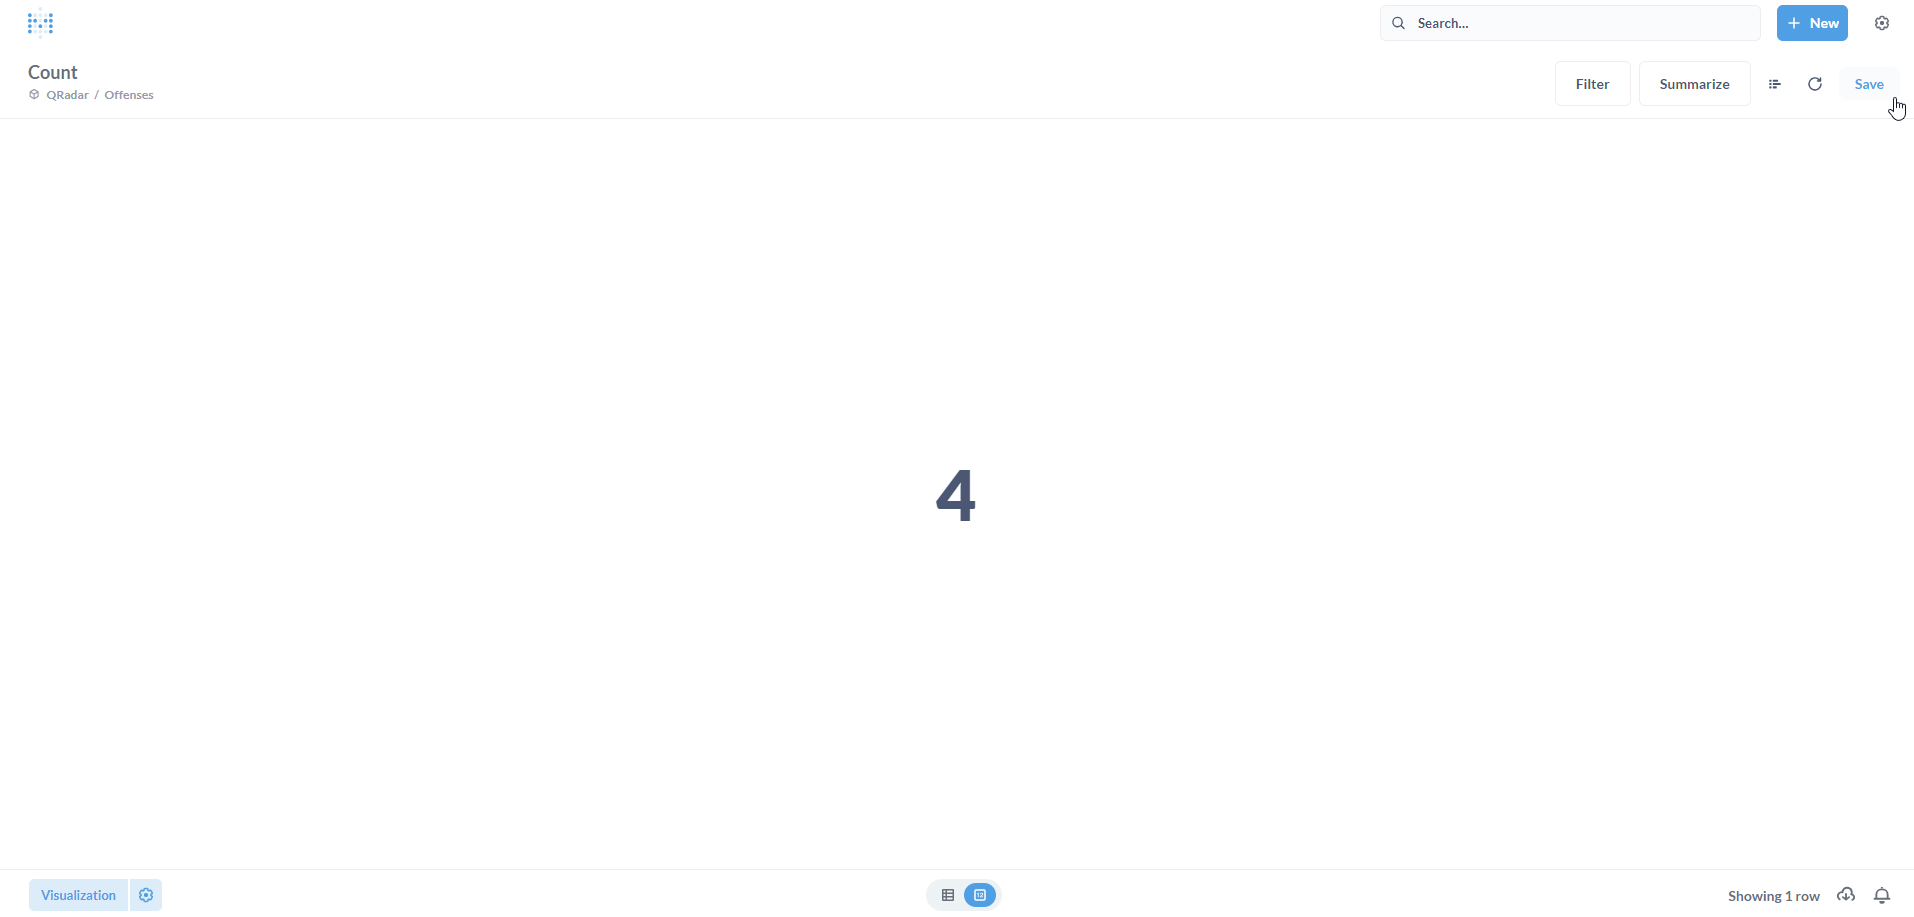
By default, the metric is Count indicating the count of rows in the Model. Click on Done. Click on Save.
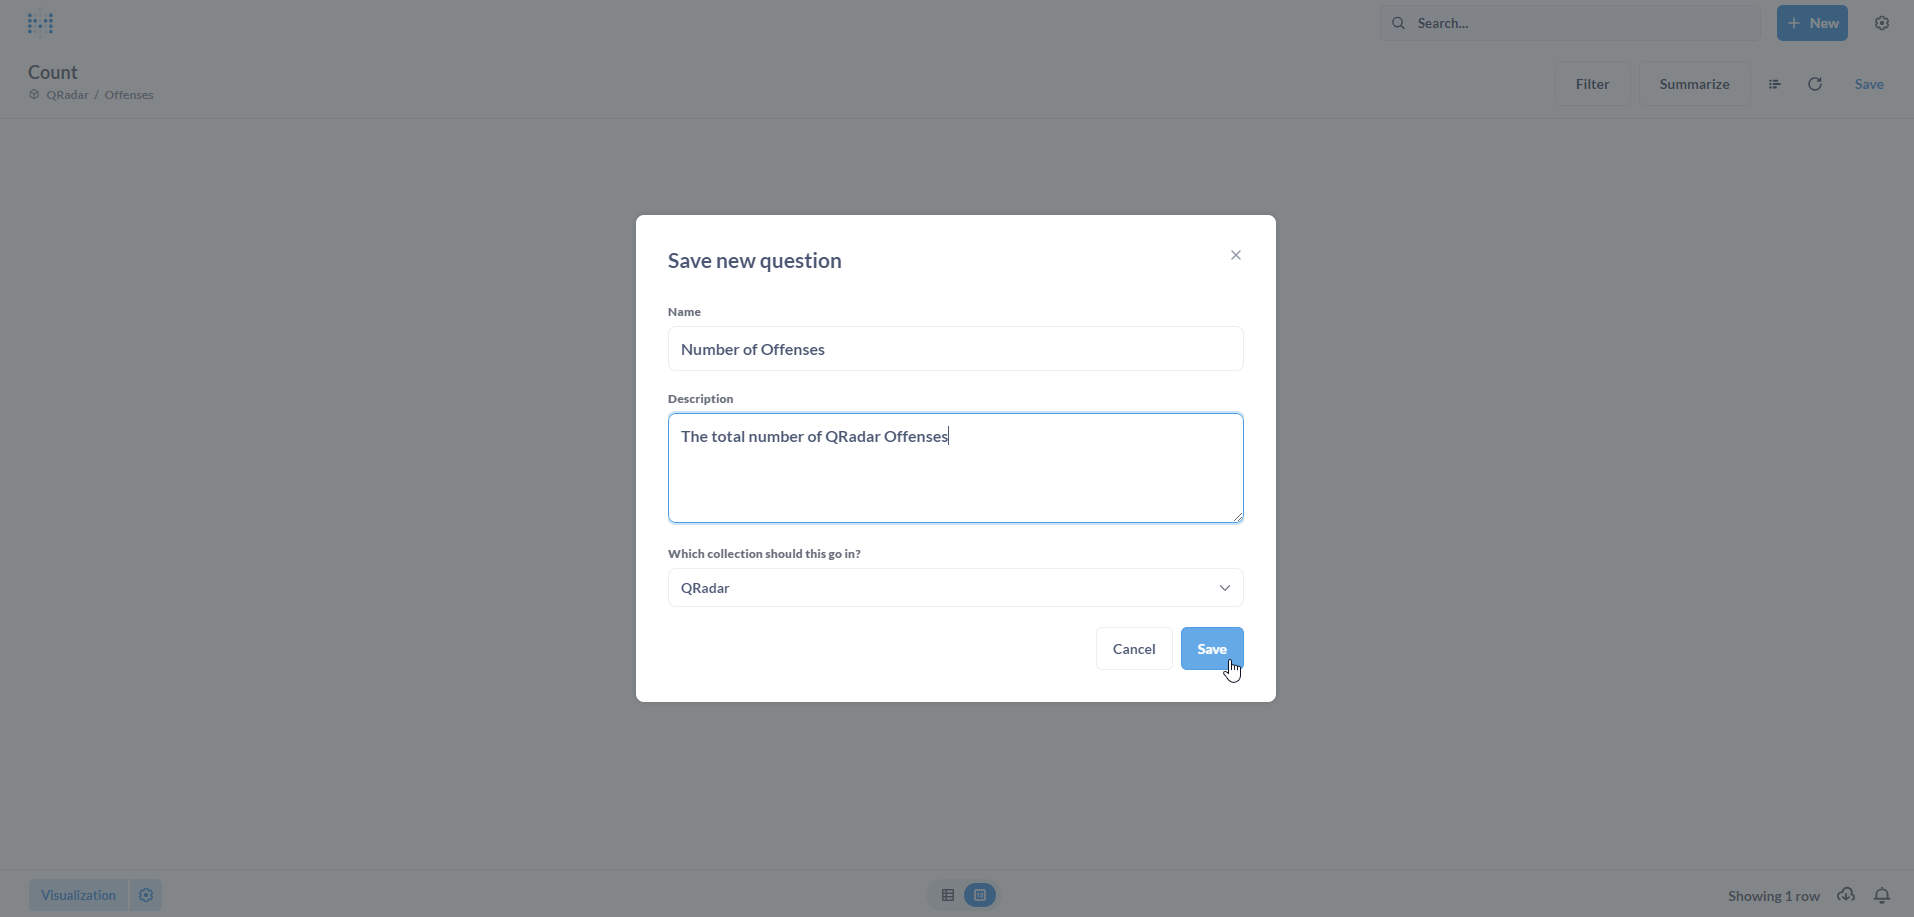
Let us save it as a new Question. Click on Save.
Populate the Save new question form with a Name and an optional Description. Click on Save.
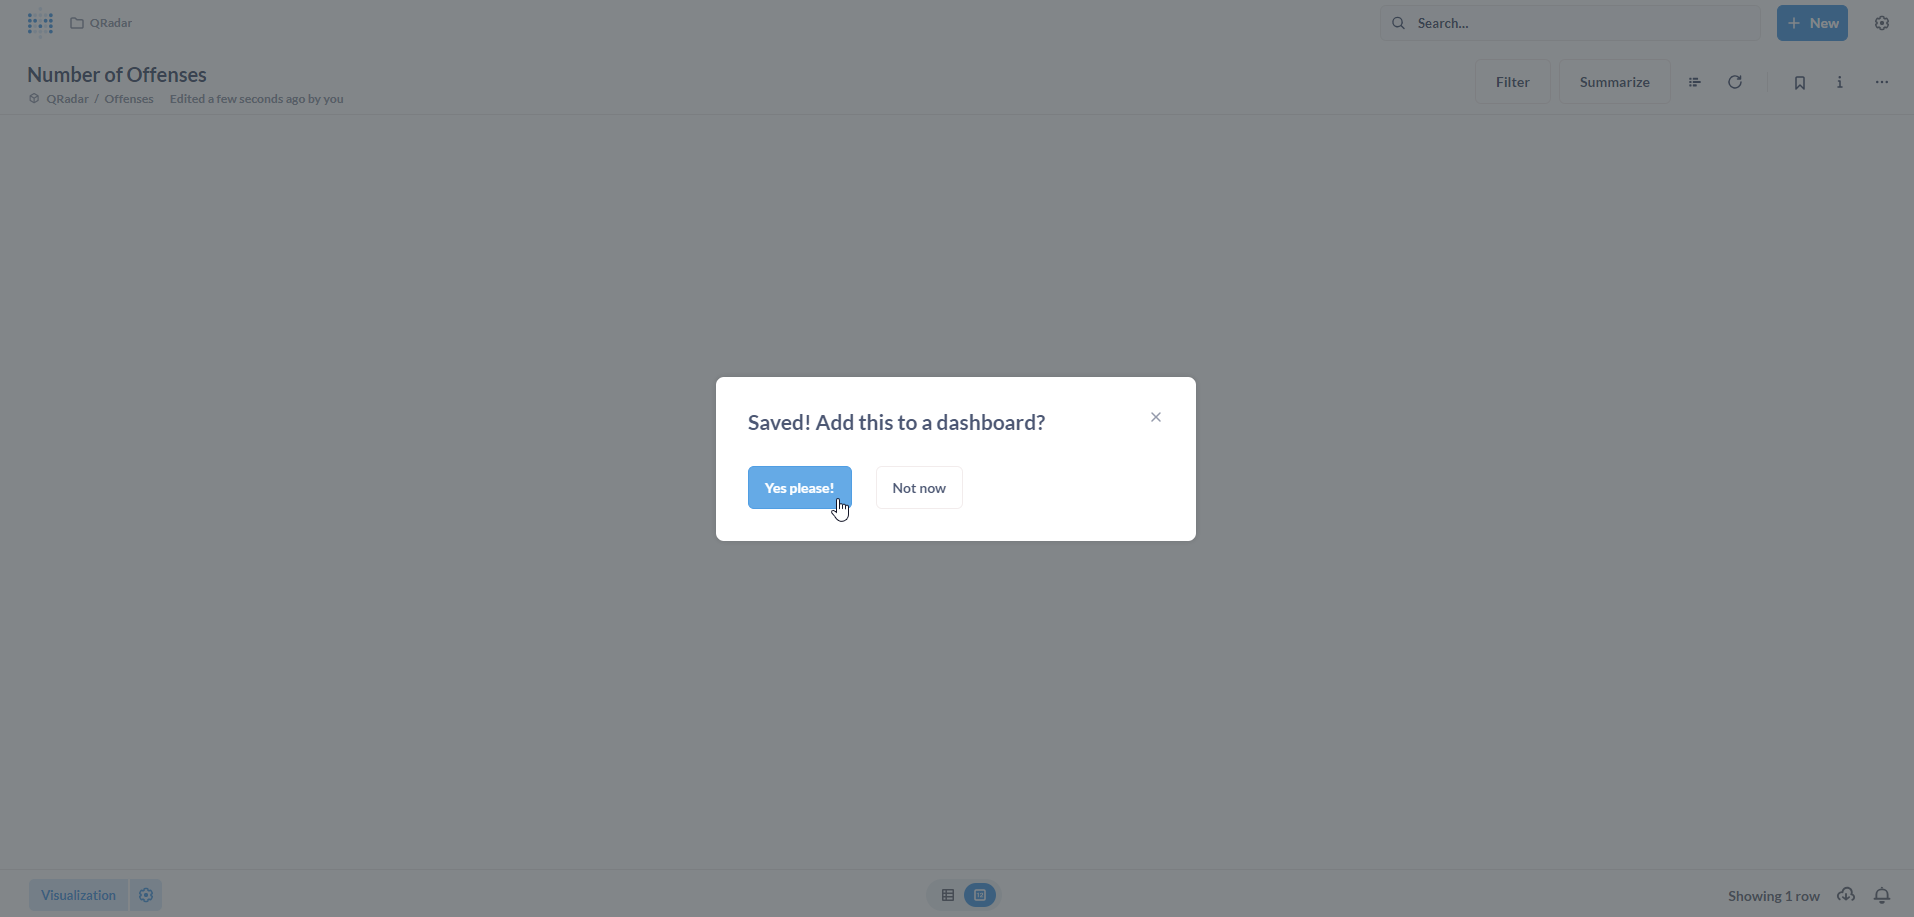
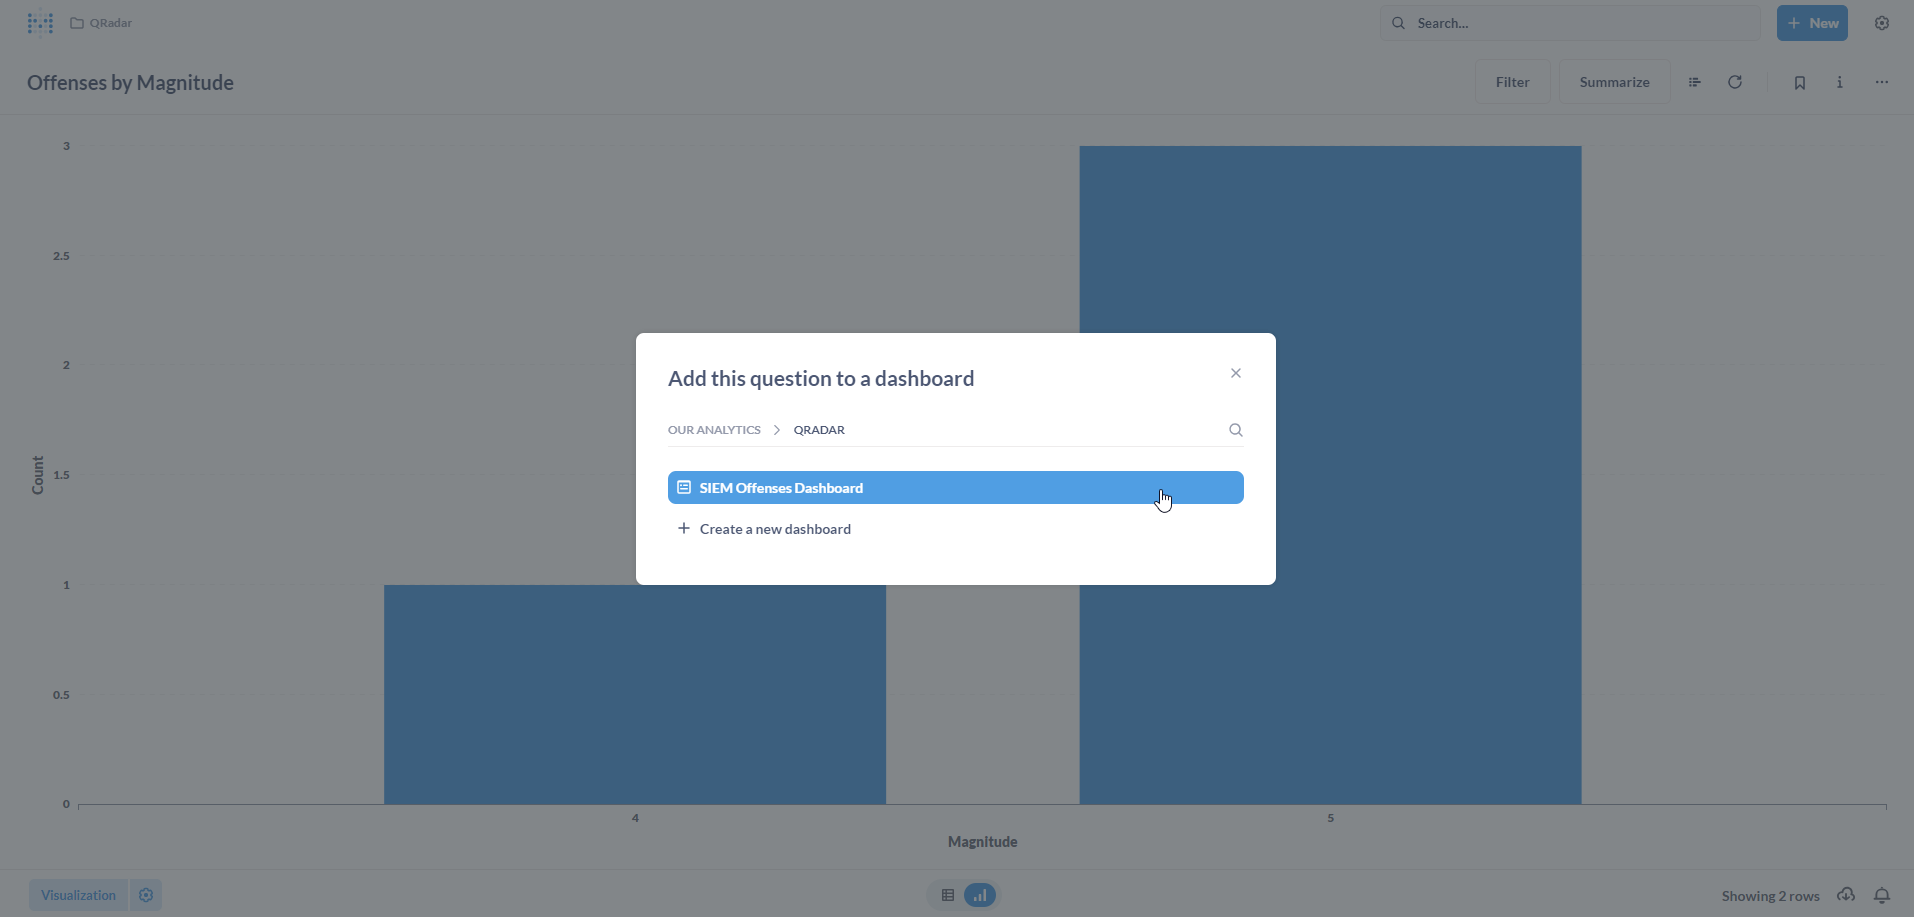
Now, we want to add this newly created Question to a Dashboard. Click on Yes please! to proceed.
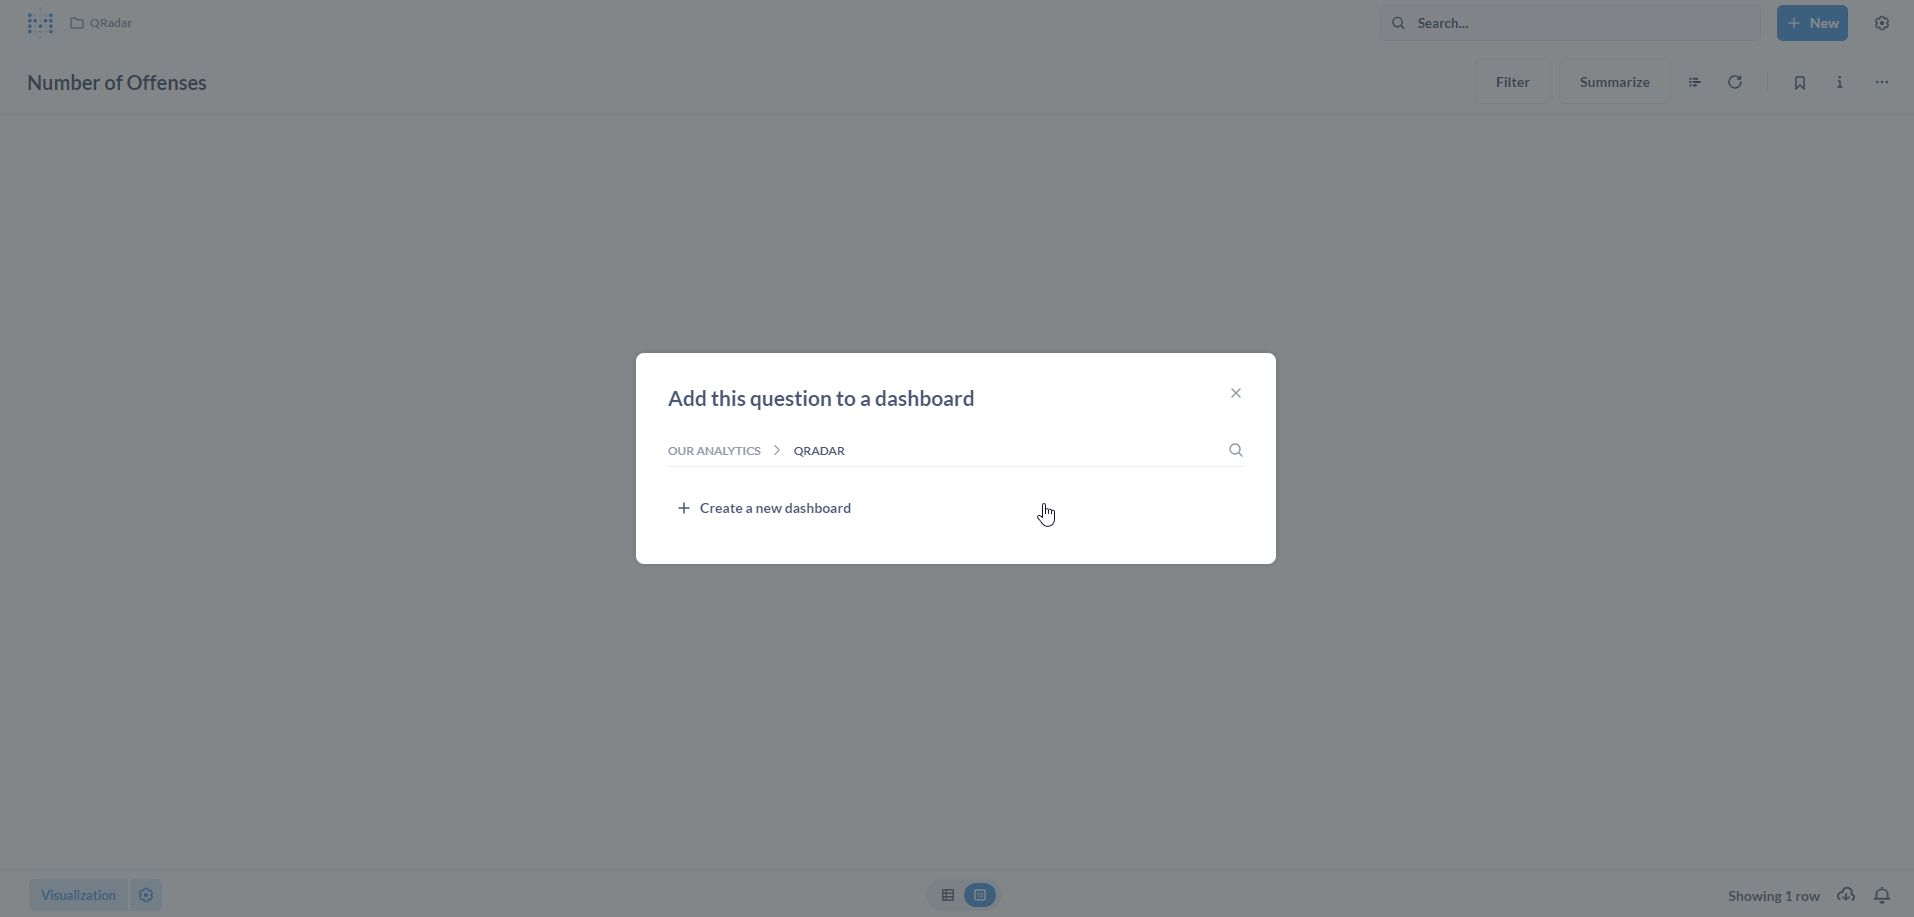
In the Add this question to a dashboard pop-up, select the QRadar Collection and click on + Create a new dashboard.
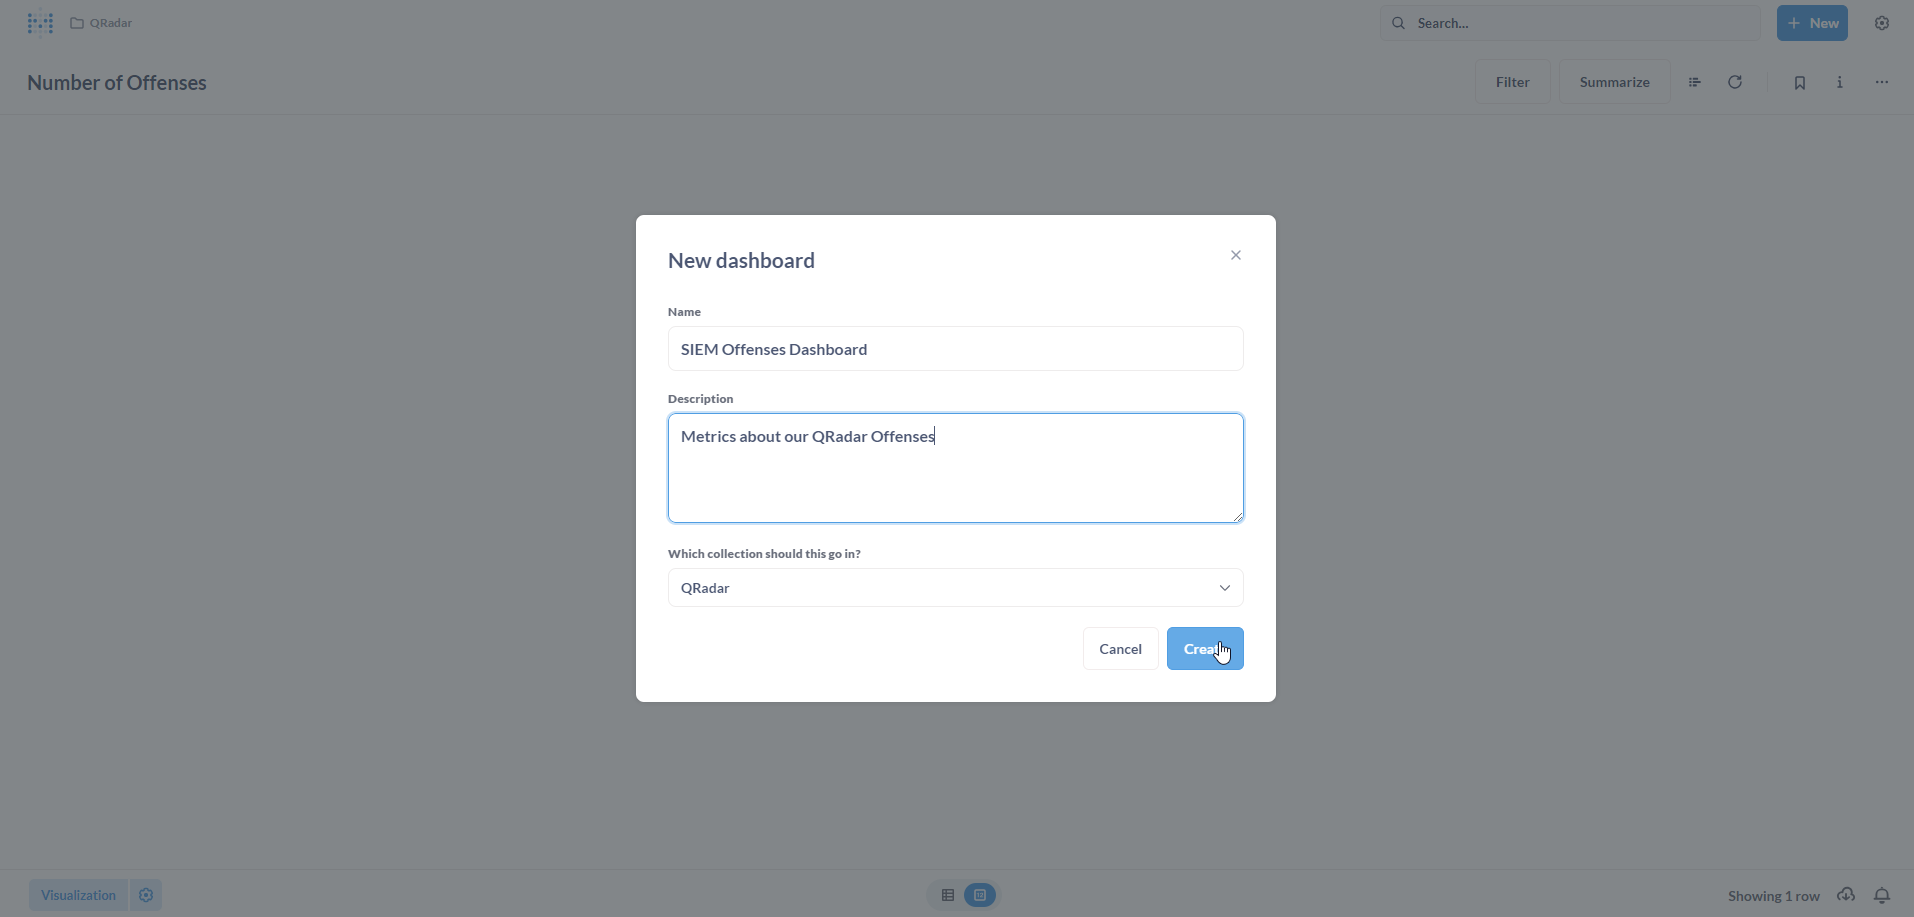
Populate the New dashboard form with a Name and an optional Description. Click on Create.
Visualize your data! This is where your creativity can shine.
Note: Please refer to this page from the Metabase documentation which explains in depth about the available visualization types and options.
For this metric (Number of Offenses), we have chosen a simple Number visualization, which looks like a scorecard.
According to Metabase documentation:
The Numbers option is for displaying a single number, nice and big.
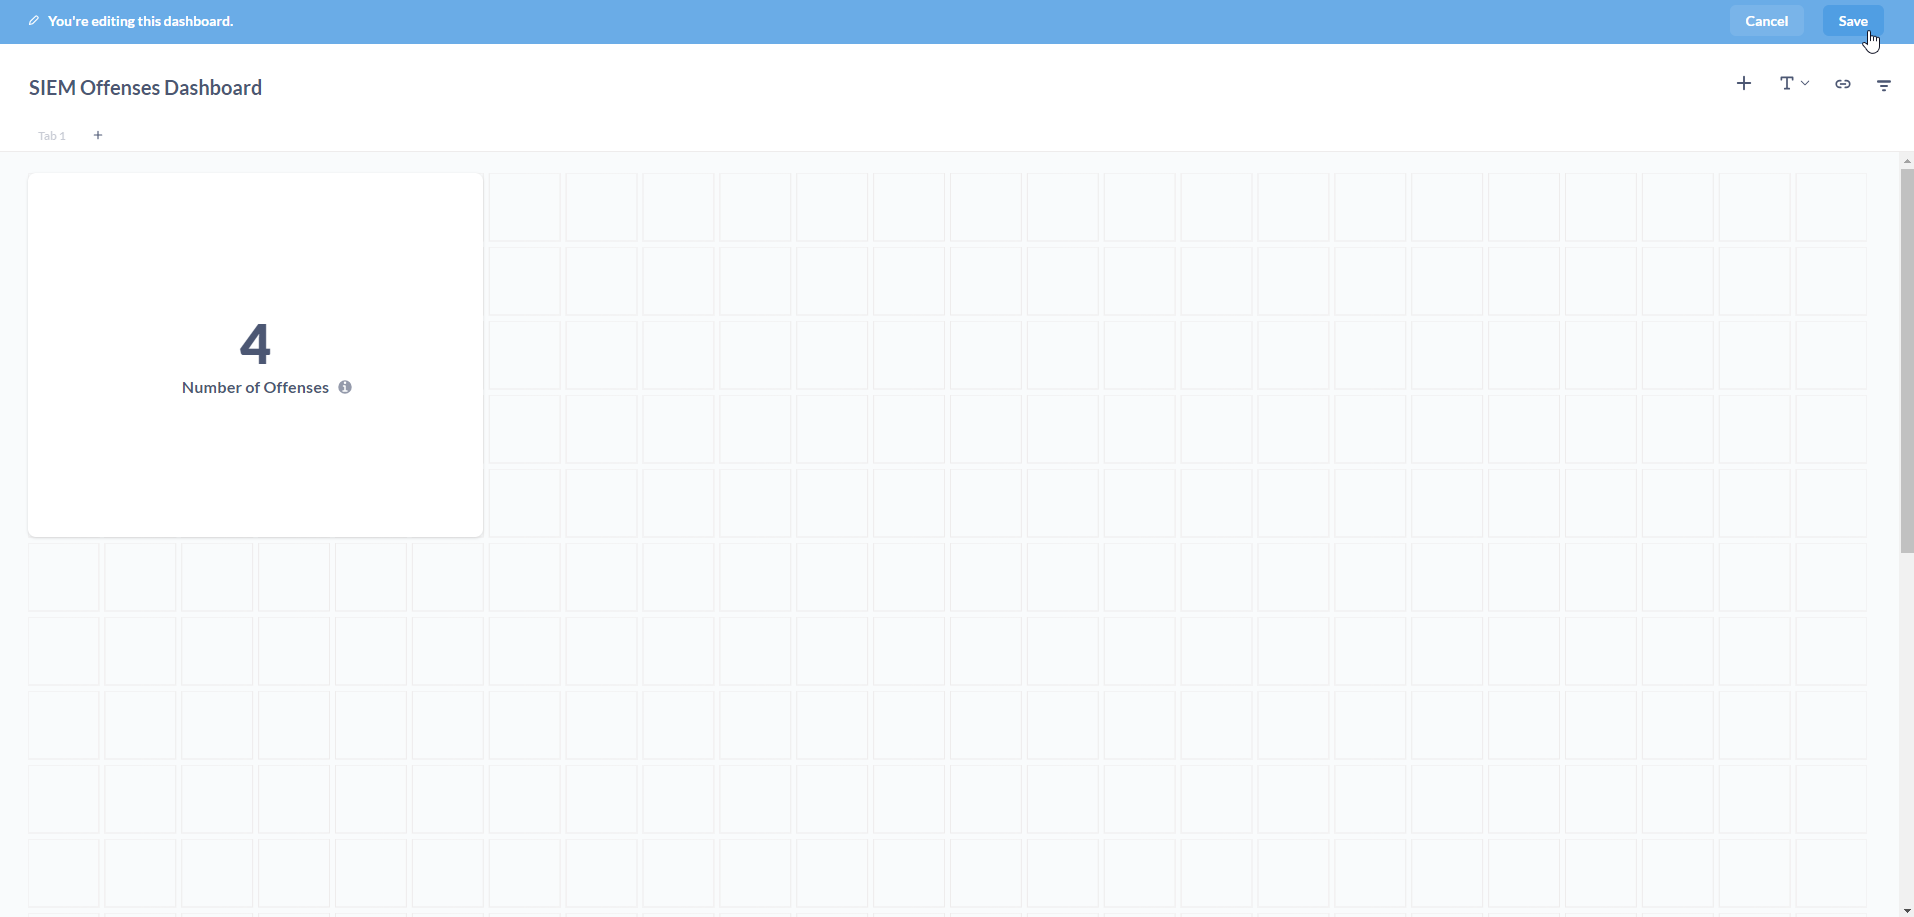
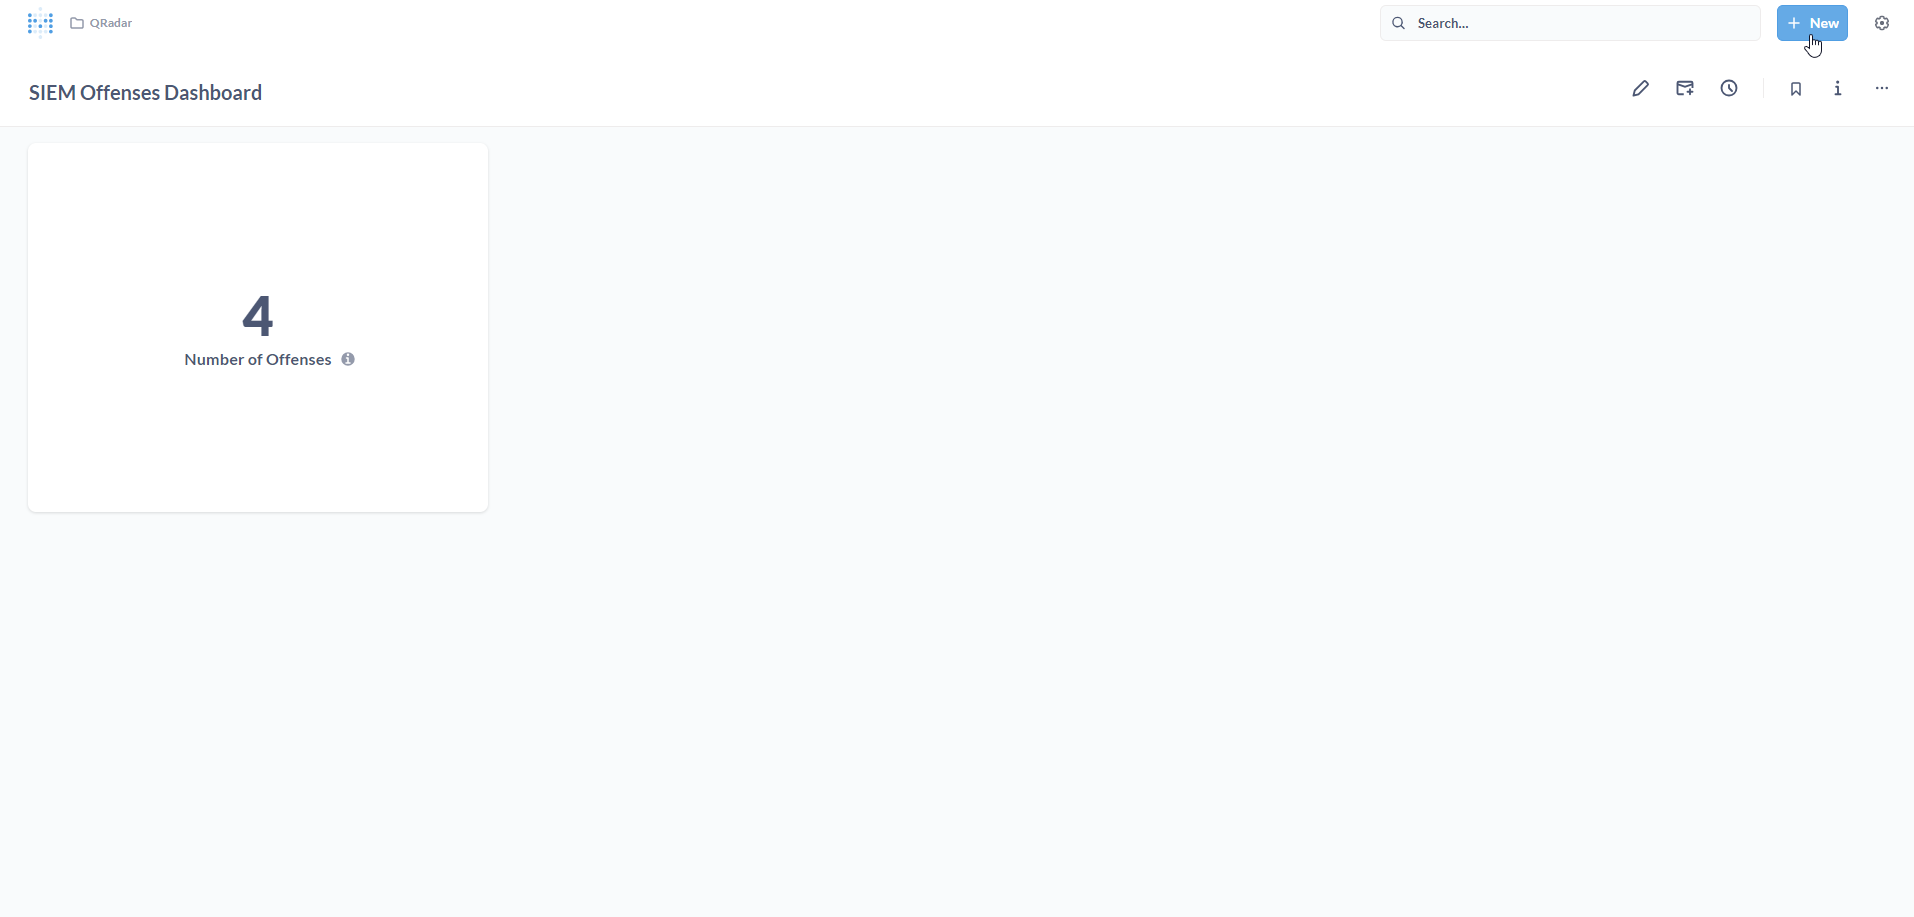
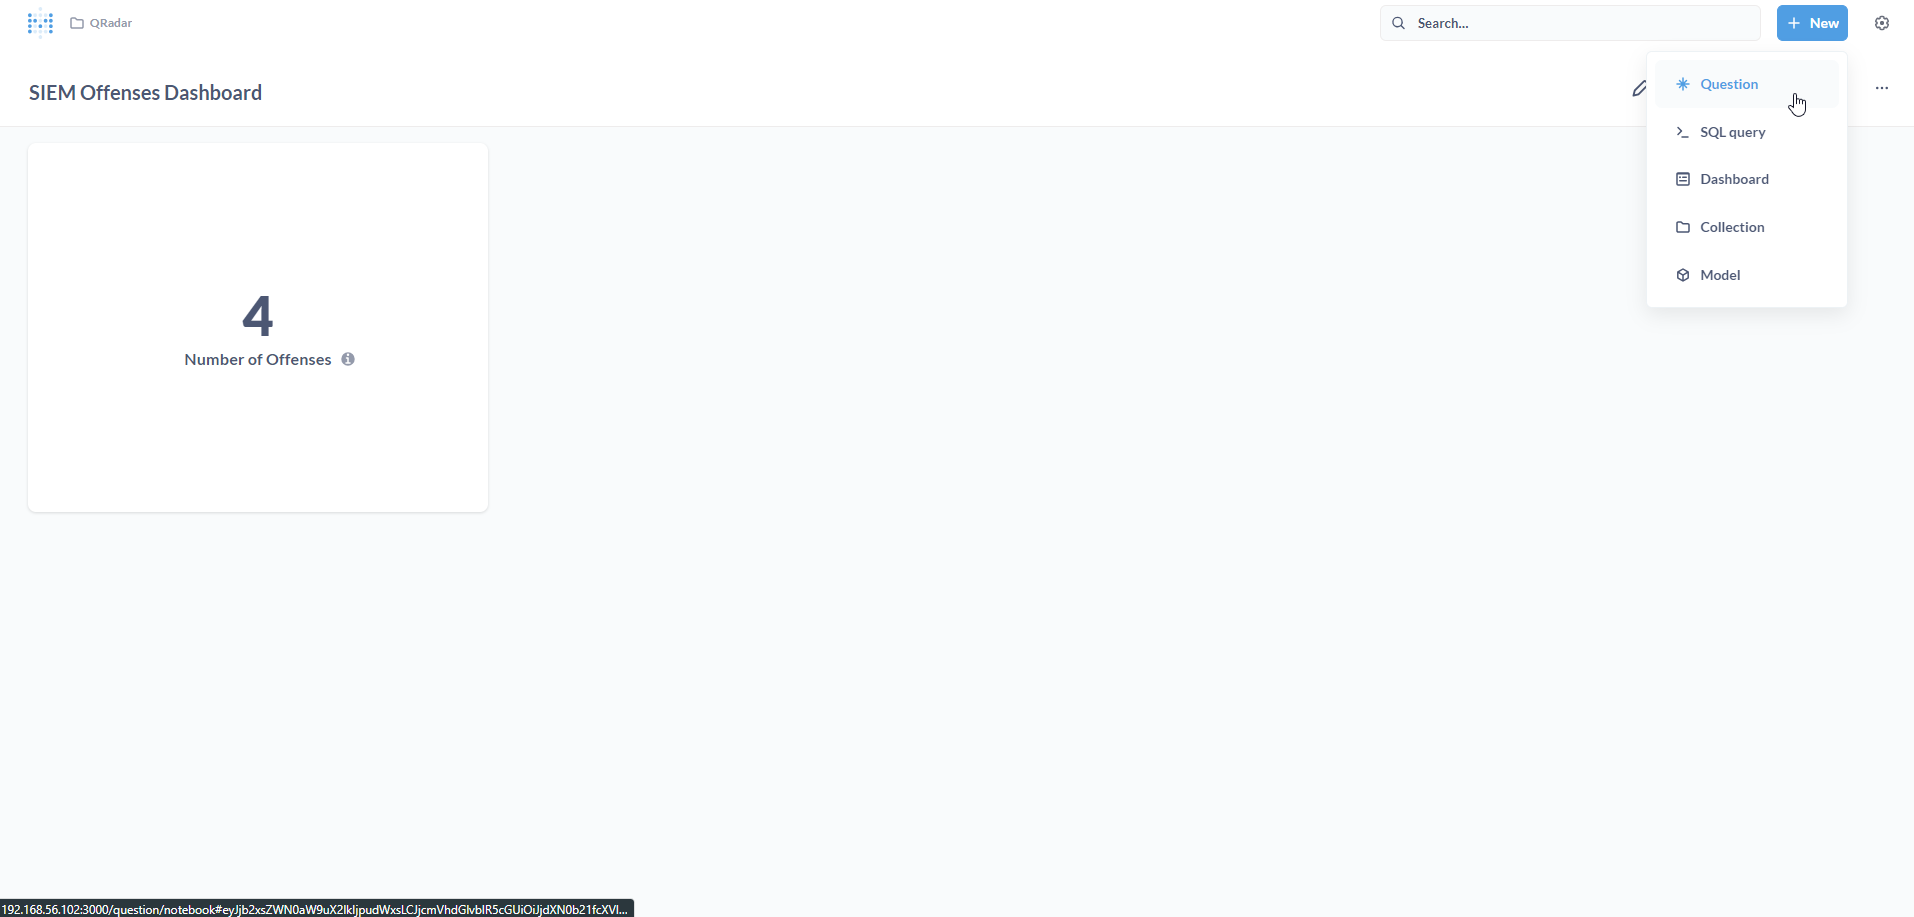
The Dashboard is displayed. Let us add some more visualizations. To do this, you will need to create new Questions. Click on + New.
Click on Question.
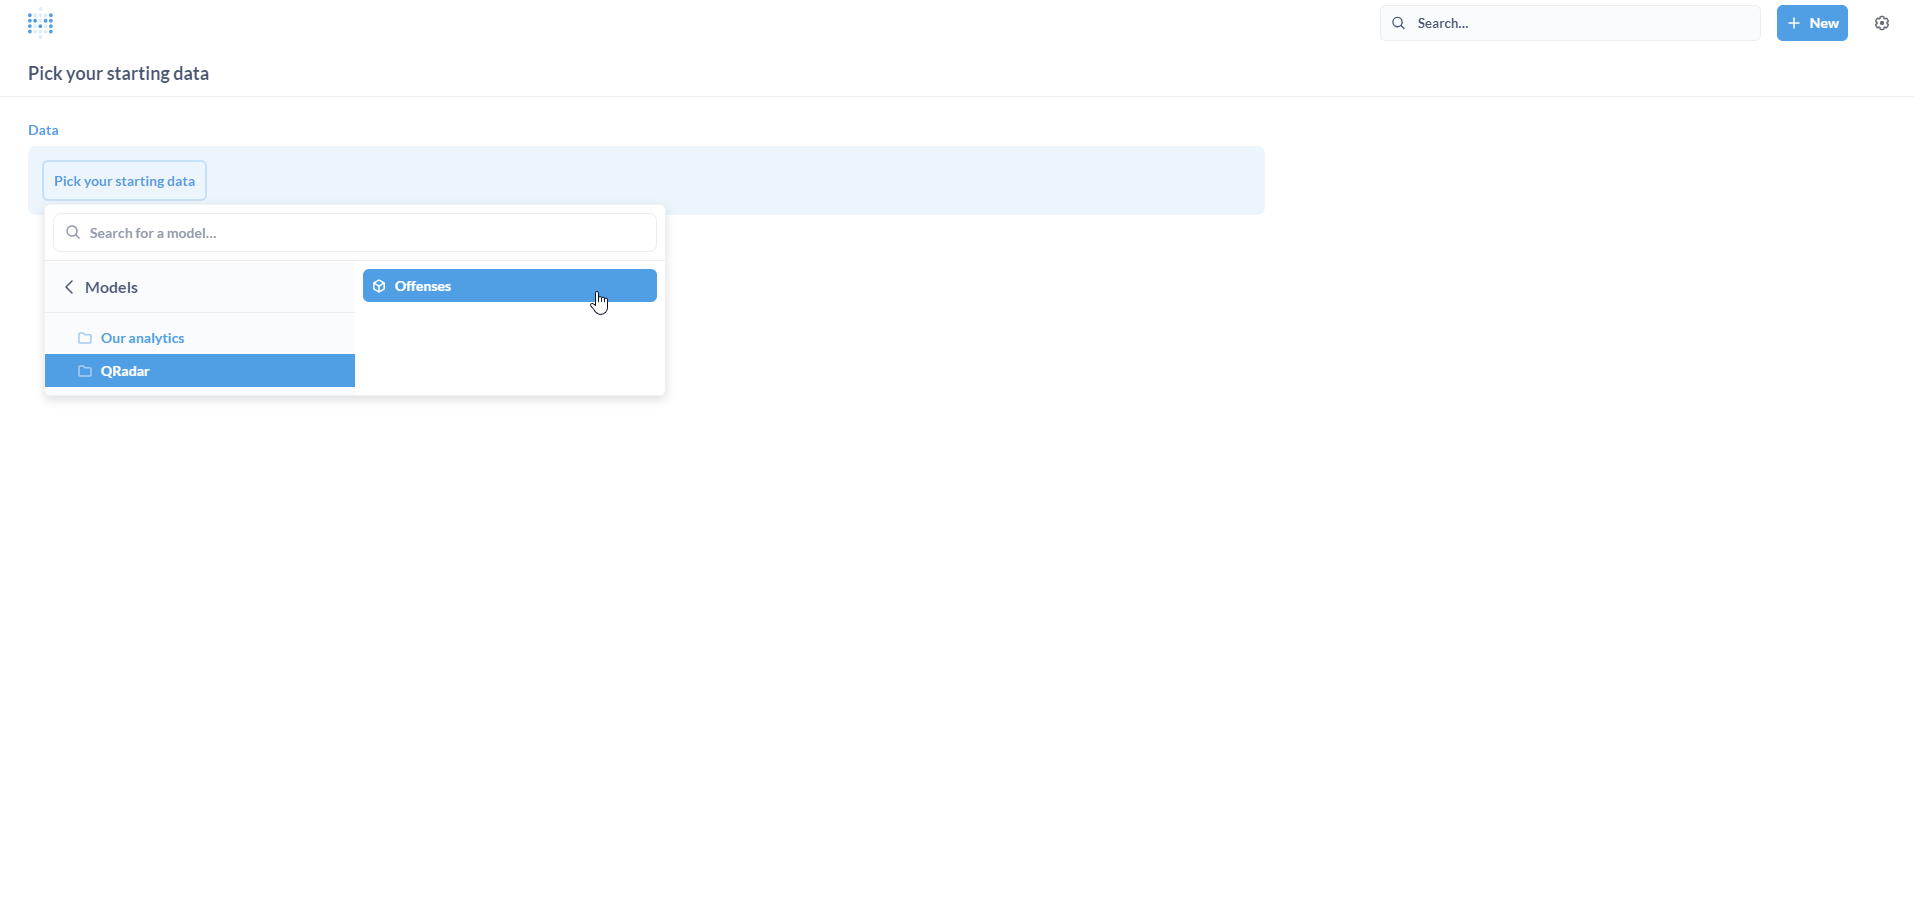
Click on Models.
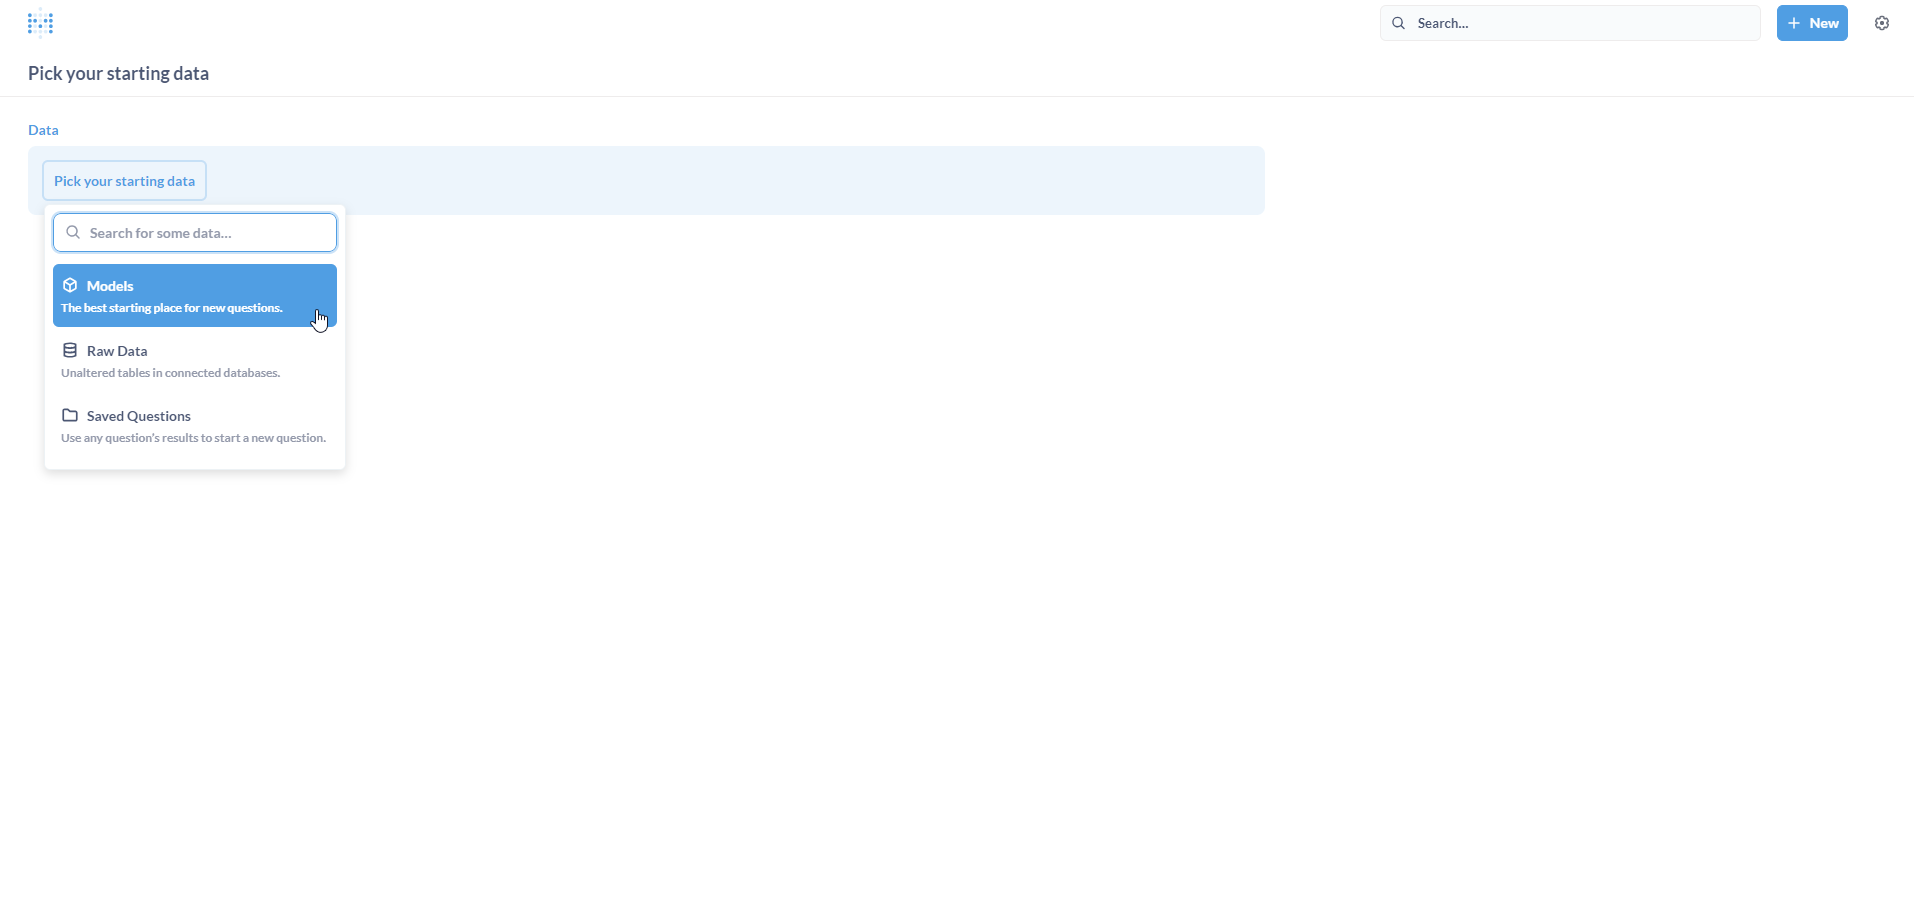
Select Offenses under QRadar.
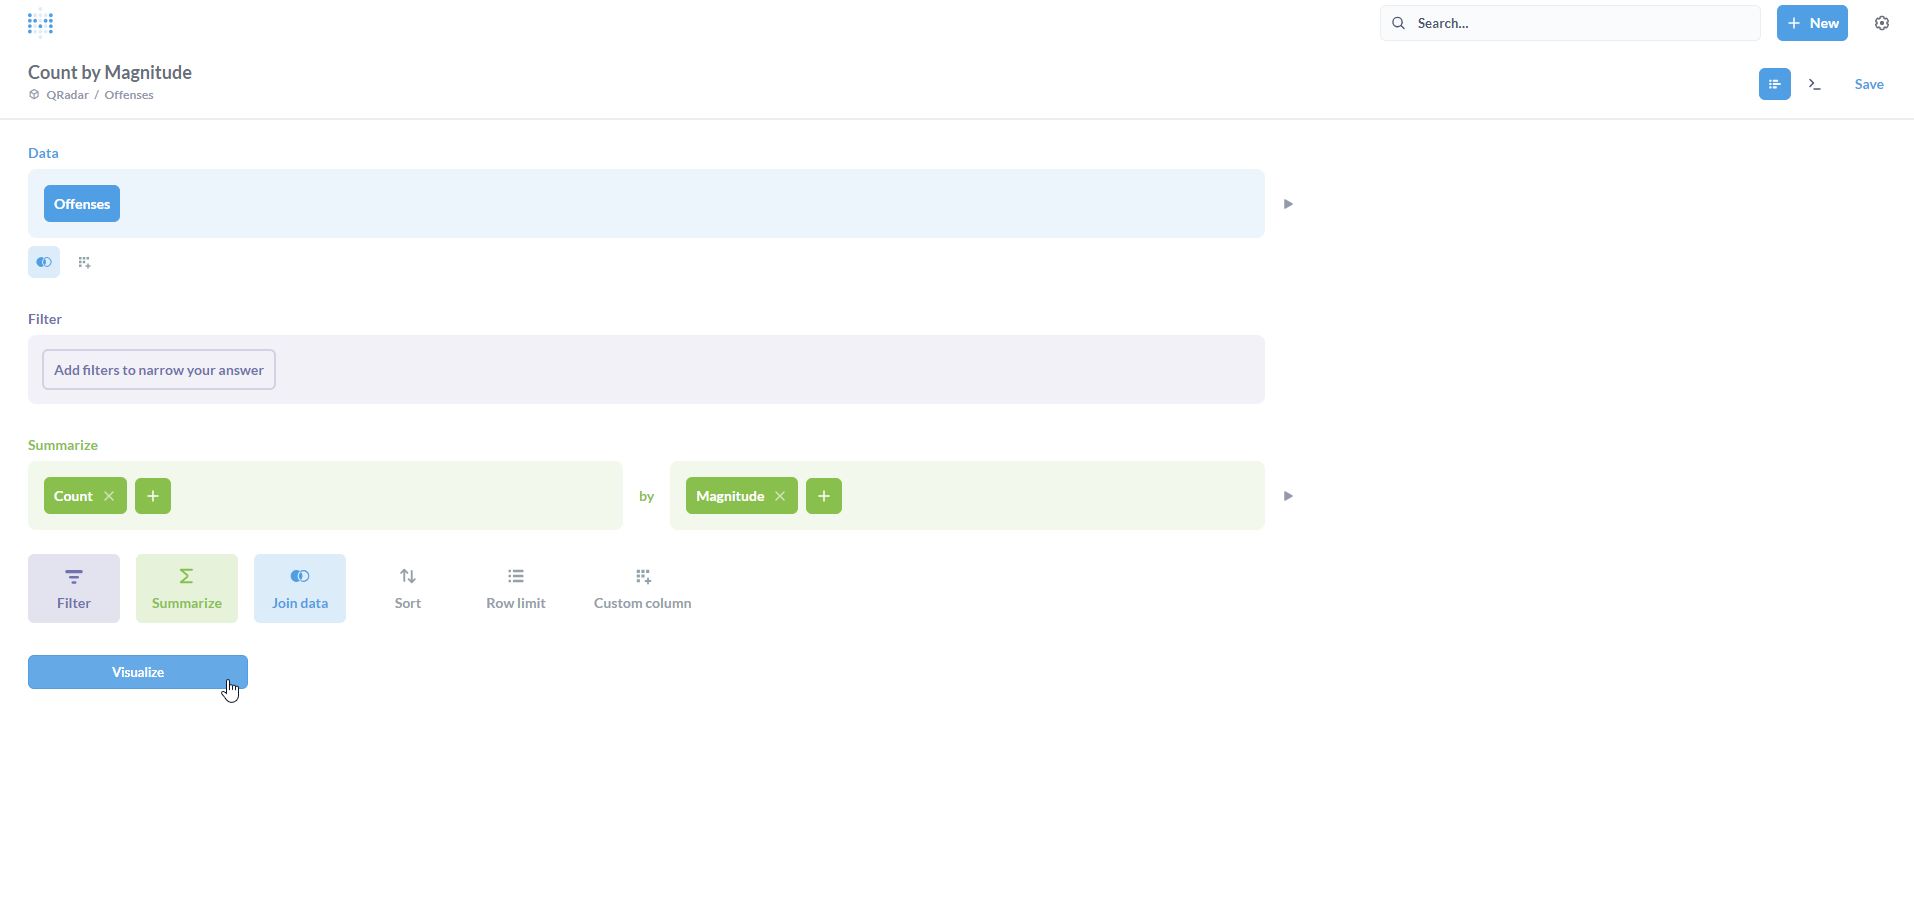
Let us attempt another simple metric (Question) - Offenses by Magnitude.
To calculate this, we need to essentially perform a count operation followed by a group-by operation on the Magnitude column. Click on Visualize.
The screenshot below illustrates how we leverage the Metabase Notebook editor to calculate this metric (Question).
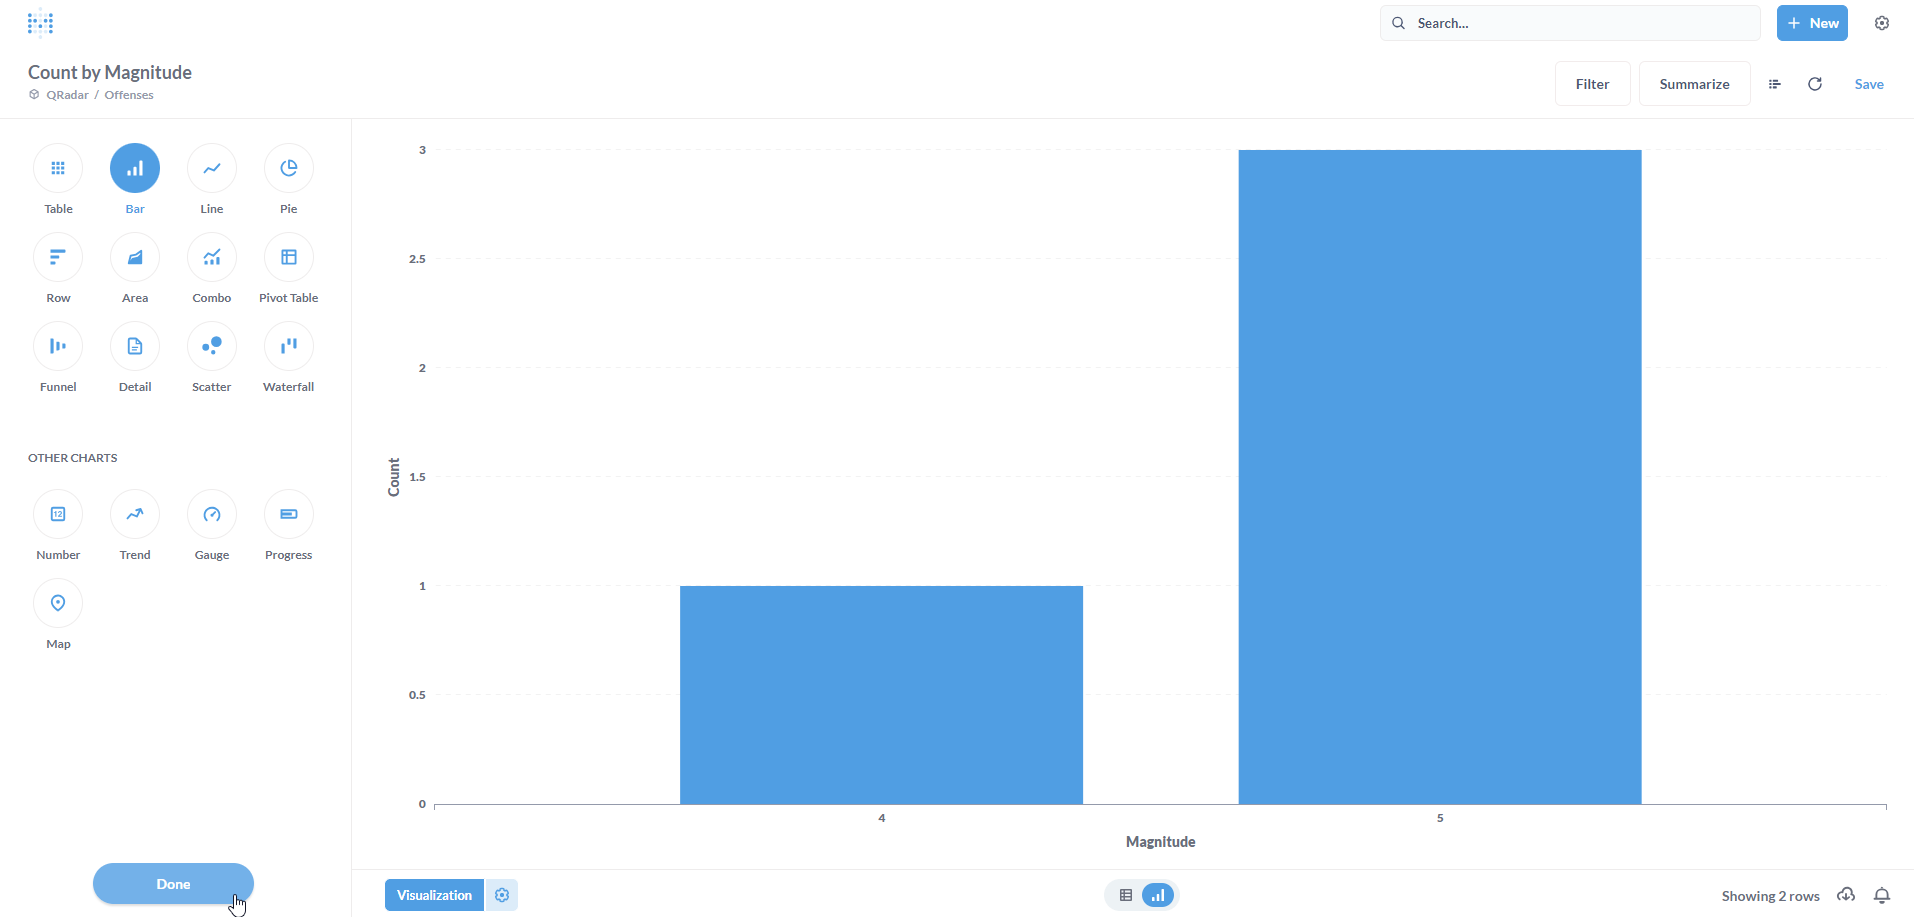
We have a table populated with the result. However, for the Dashboard, we would prefer a visualization. Click on Visualization on the bottom-left.
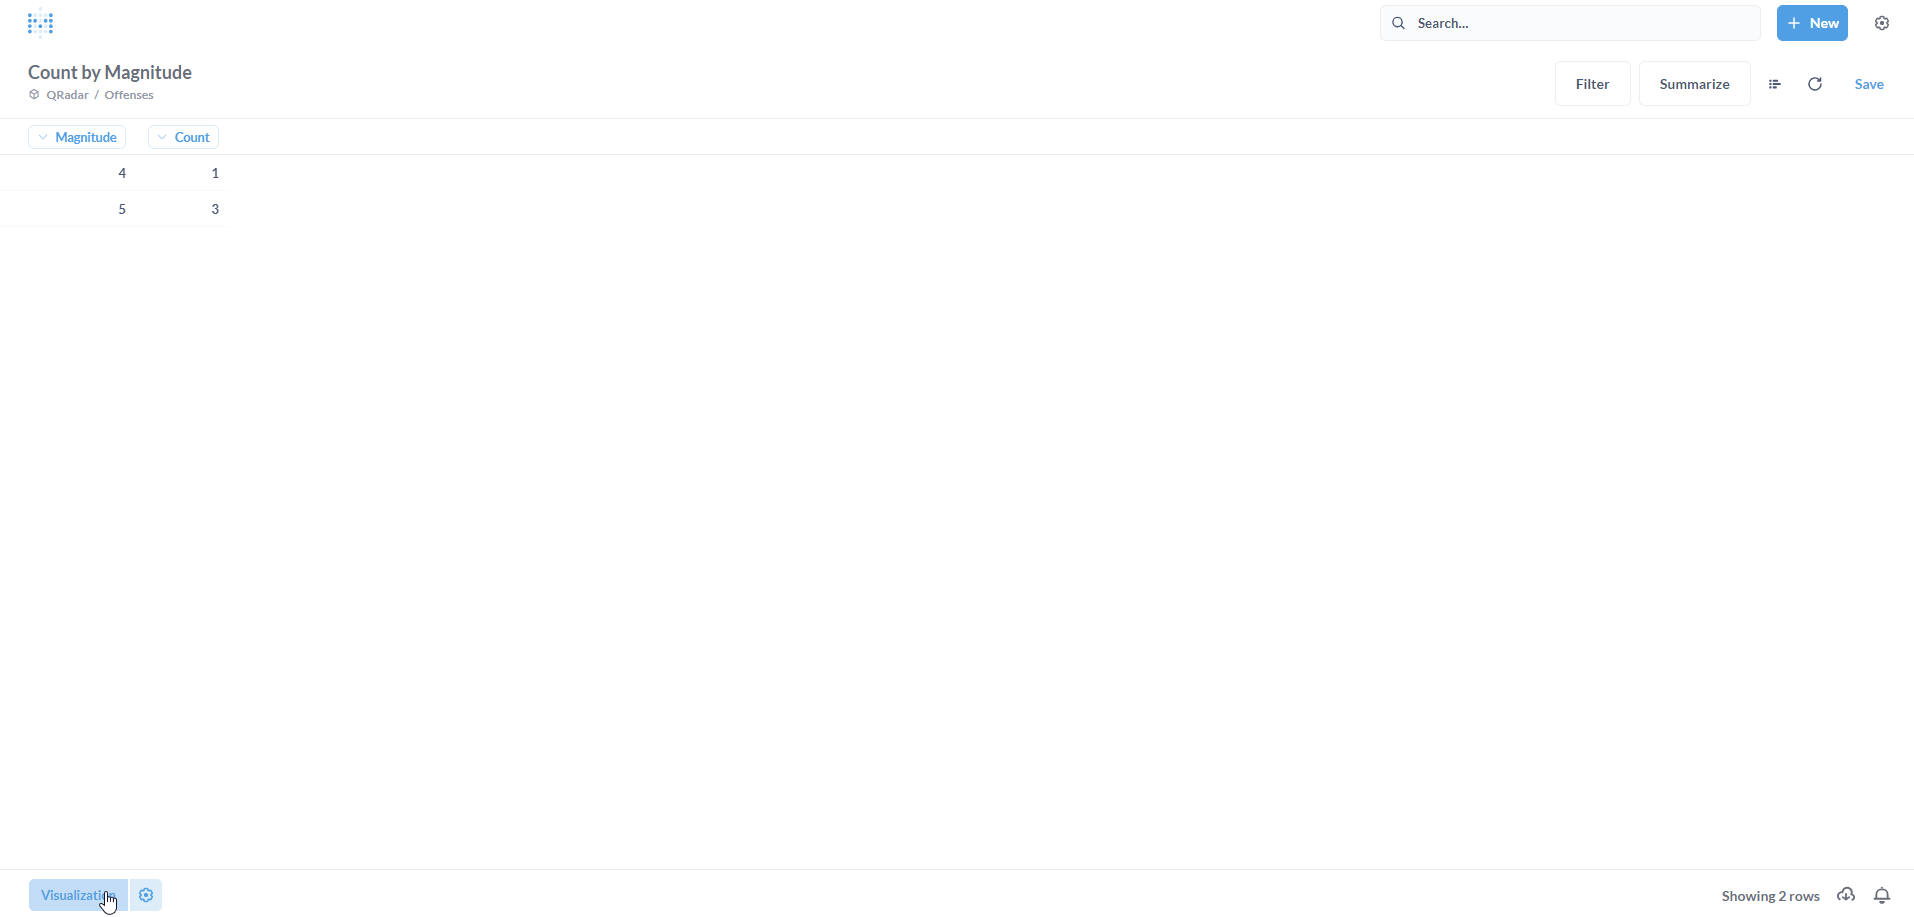
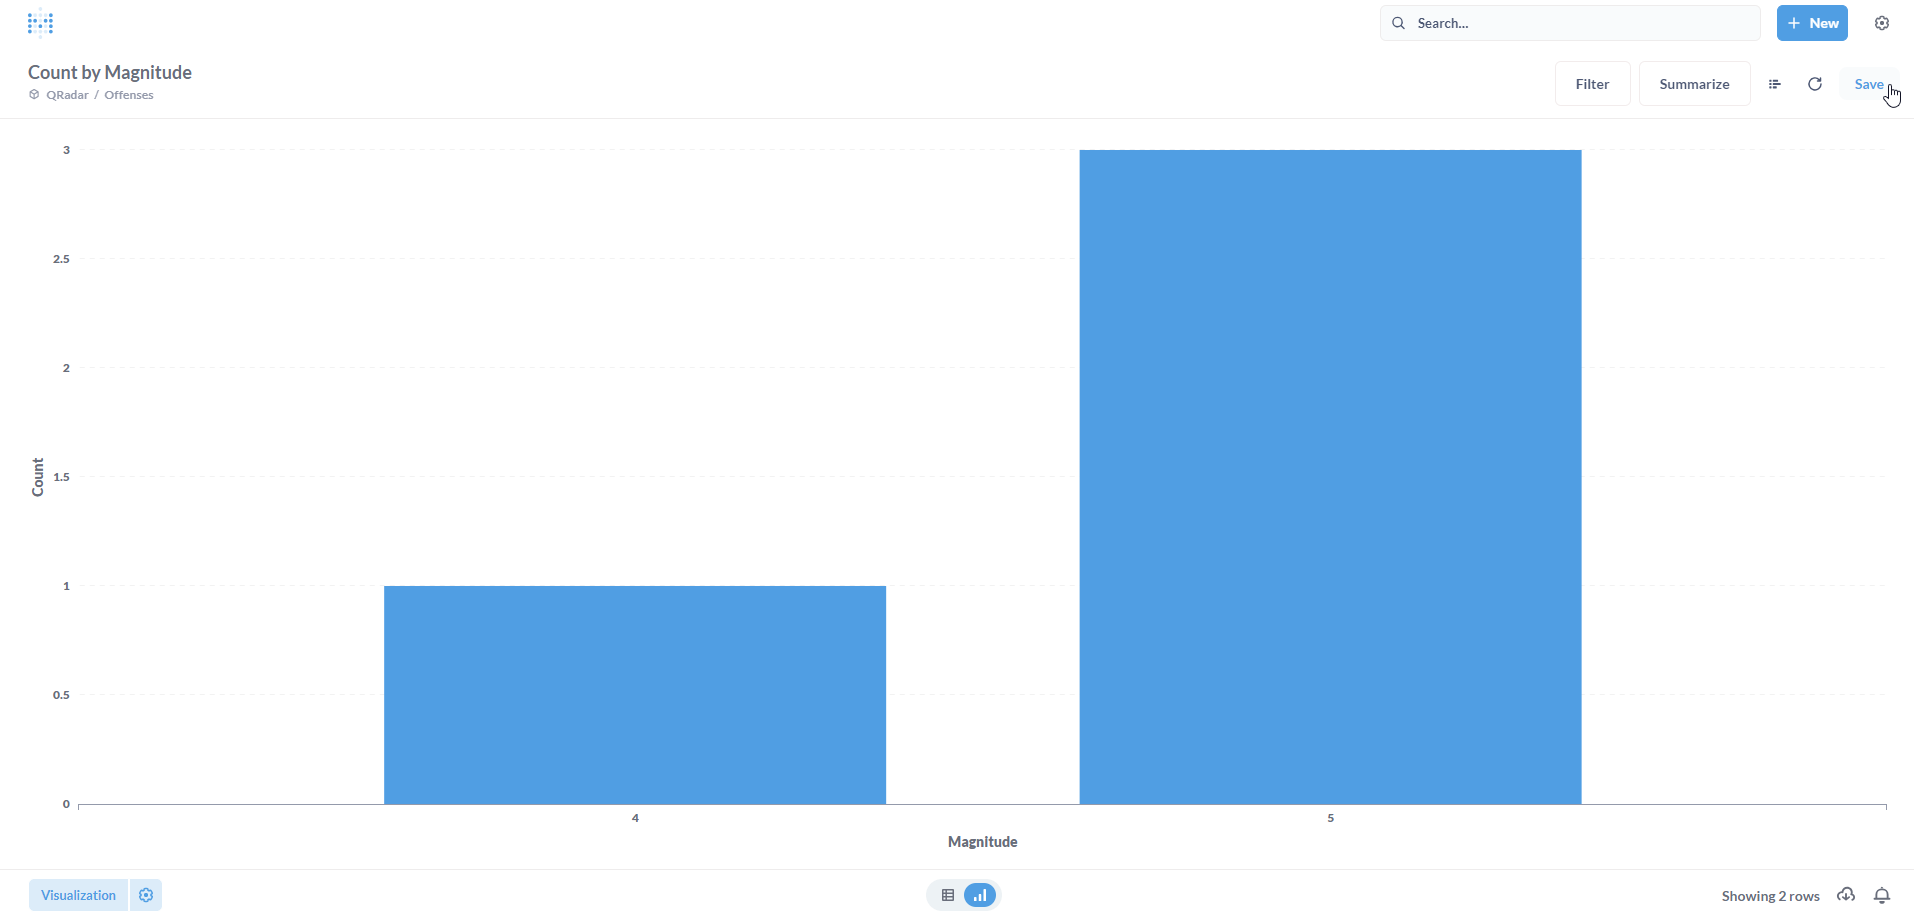
A bar chart typically works well to represent a simple distribution. Again, it’s completely your choice on what visualization to pick :) Click on Done.
Click on Save.
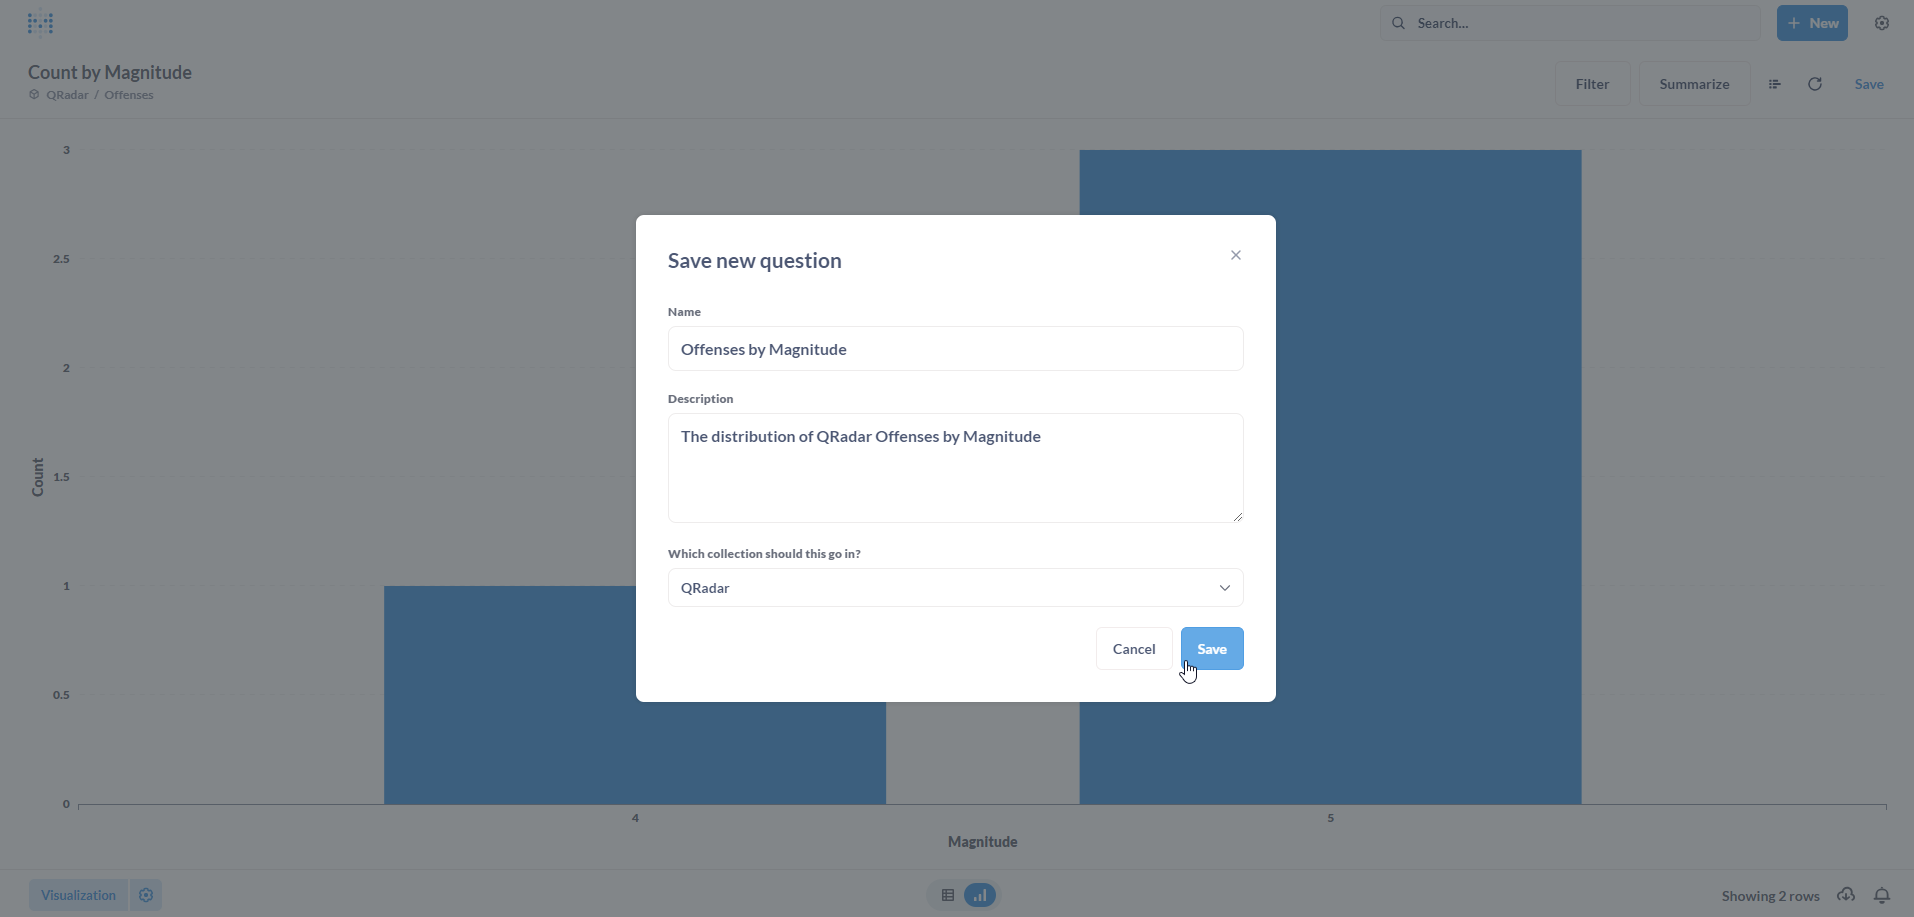
Populate the Save new question form with a Name and an optional Description. Click on Save.
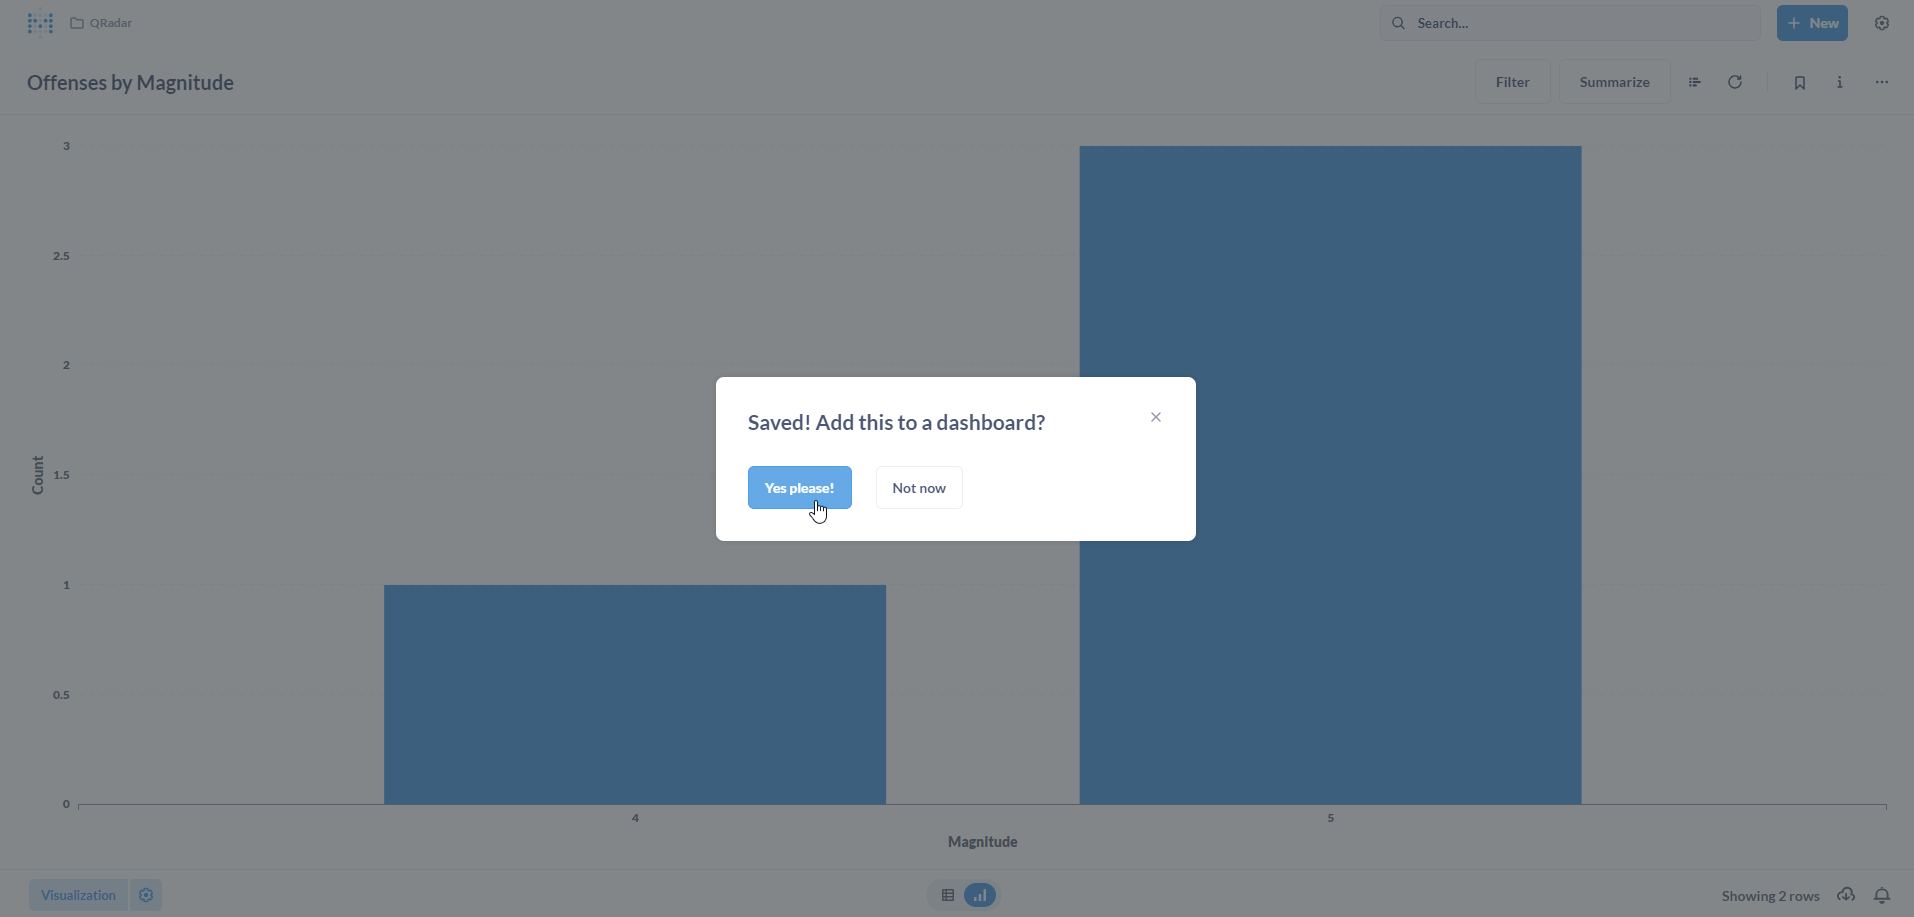
Now, we want to add this newly created Question to a Dashboard. Click on Yes please! to proceed.
Select our existing SIEM Offenses Dashboard.
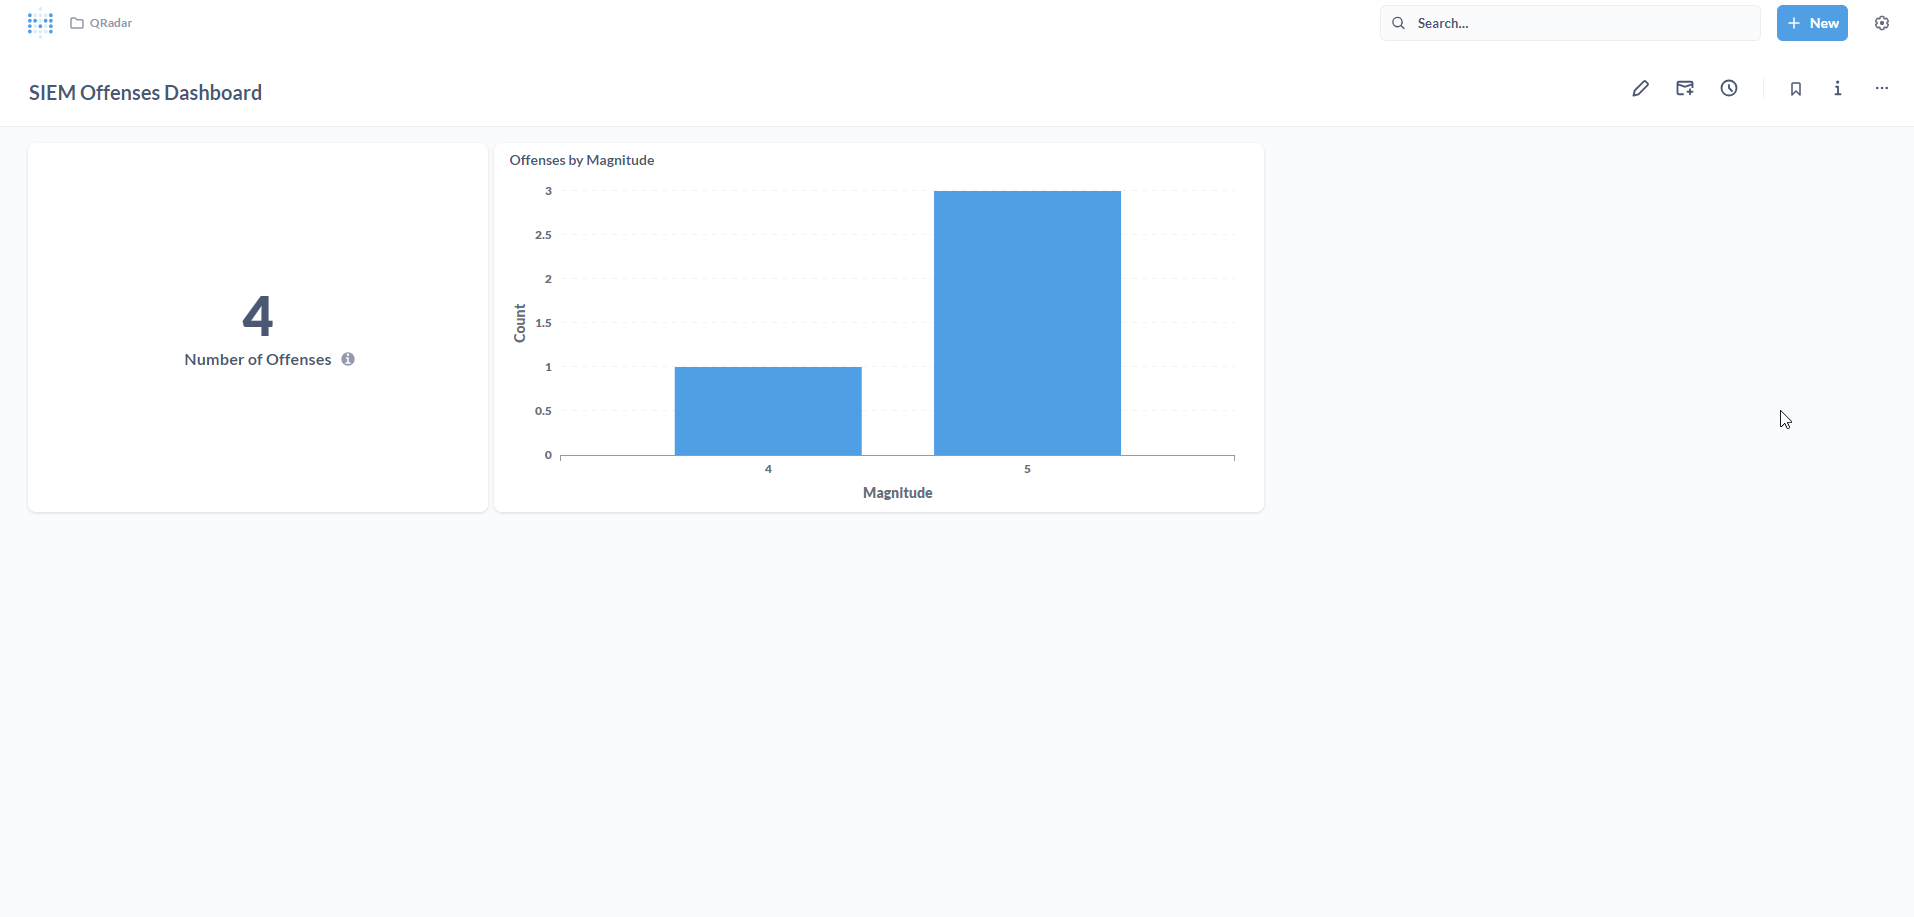
Add the visualization to the Dashboard. Click on Save.
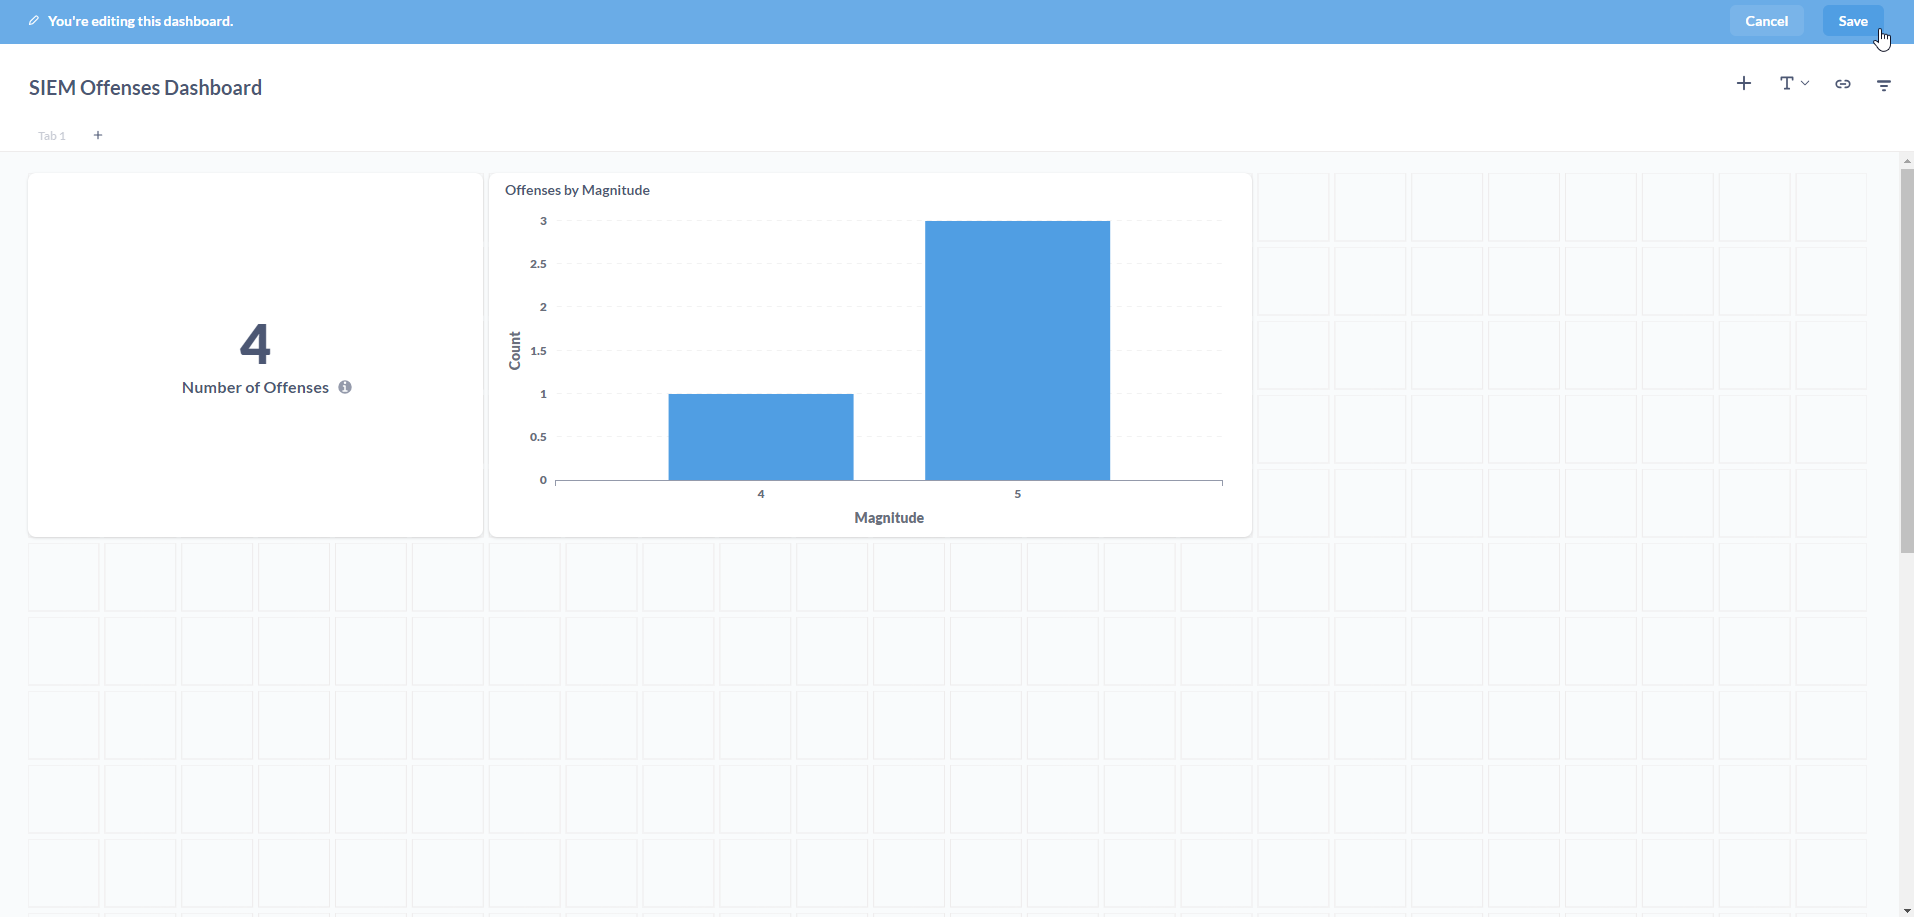
Great! We now have two visualizations on our SIEM Offenses Dashboard. Feel free to come up with your own metrics (Questions) and add them to your Dashboard.
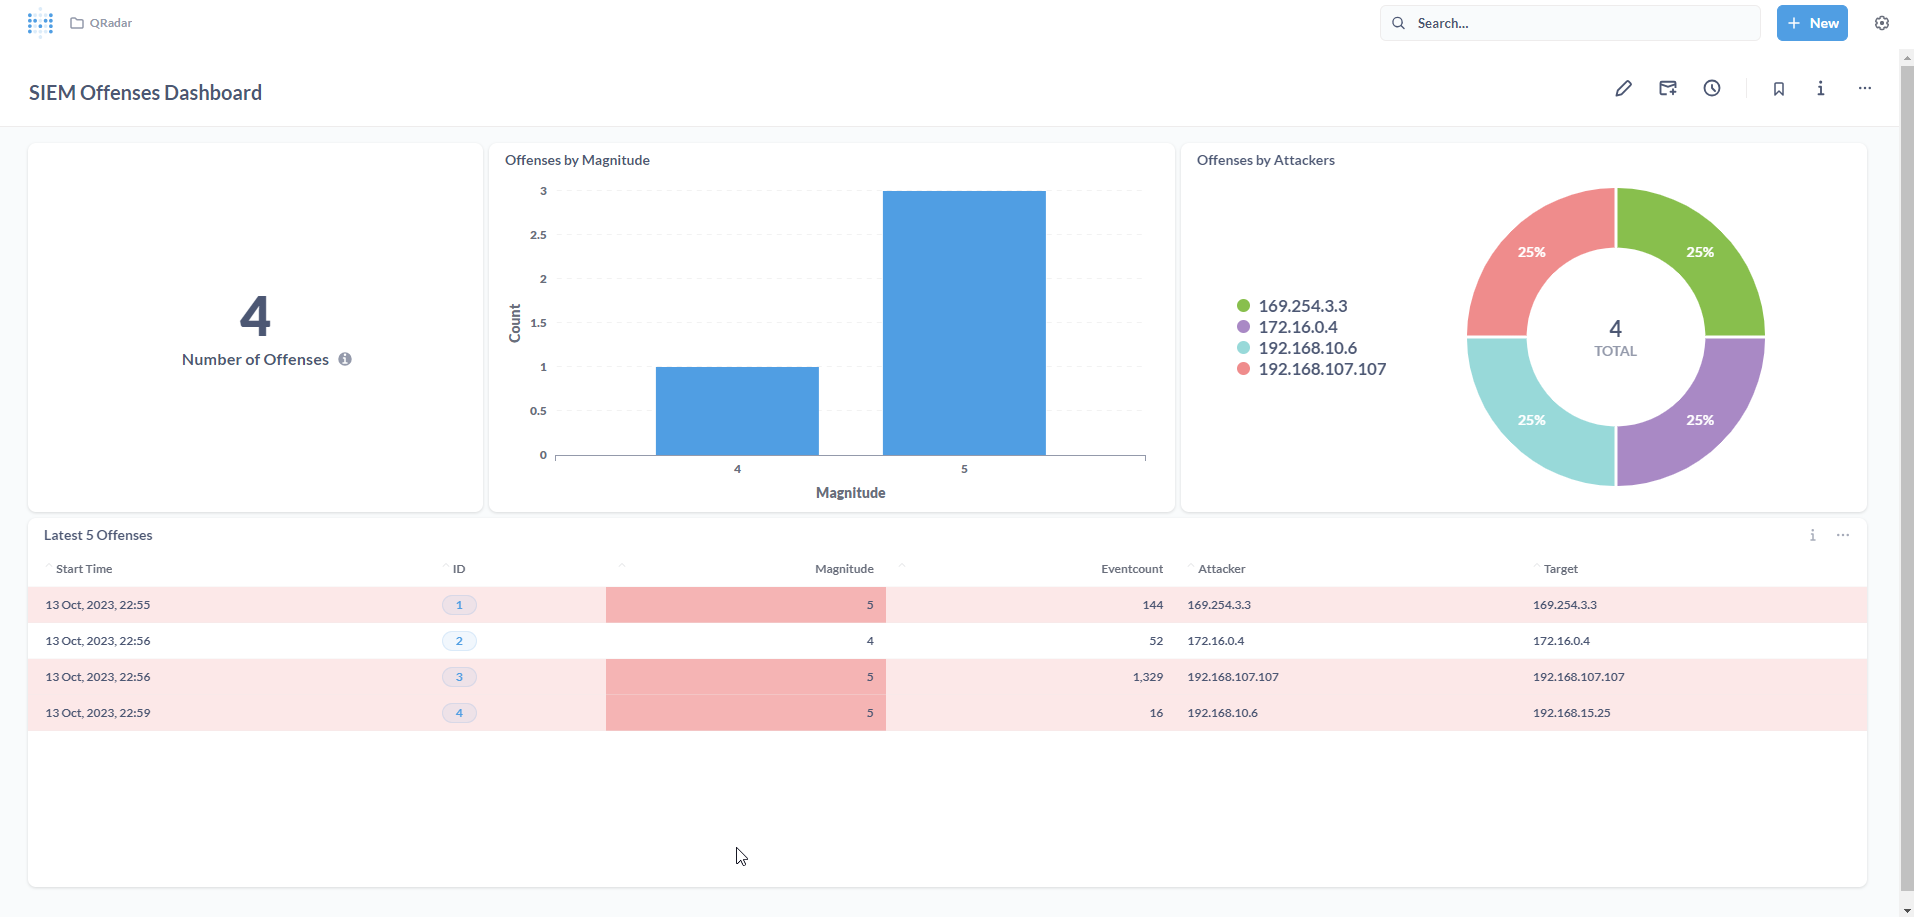
Here’s what my final Dashboard looks like!
Conclusion
In this tutorial, we learnt how to build a simple QRadar Dashboard on Metabase, an open-source BI tool, using its new CSV upload feature.
Metabase is a fantastic BI tool and the CSV upload feature is an absolute game changer. While it is still in its infancy, it seems promising for small SOC/SecOps teams to quickly visualize and create ad hoc Dashboards. That being said, for more resilient and automated reporting, the preferred approach should be to leverage ETL pipelines. With the right data engineering and architecture in place, Metabase can easily connect to your database/data warehouse and seamlessly refresh Dashboards.
It is to be noted that one of the biggest caveats of the CSV upload feature is to do with the CSV file size limit.
According to Metabase documentation:
CSV files cannot exceed 50 MB in size.
But, they have offered a workaround:
If you have a file larger than 200 MB, the workaround here is to:
- Split the data into multiple files.
- Upload those files one by one. Metabase will create a new model for each sheet.
- Consolidate that data by creating a new question or model that joins the data from those constituent models created by each upload.
Using the concepts and steps from this tutorial, you can easily build sophisticated Dashboards with multiple Models representing various QRadar entities such as Offenses, Events, Rules and Networks. If you are limited by the GUI, you can always leverage the Metabase SQL editor. It is to be noted that Metabase does offer Pro and Enterprise versions of their software (cloud and on-prem options available). Depending on your requirements, you may either opt for the open-source version or a premium one.
I hope you enjoyed reading this tutorial. Please reach out if you have any questions or comments.